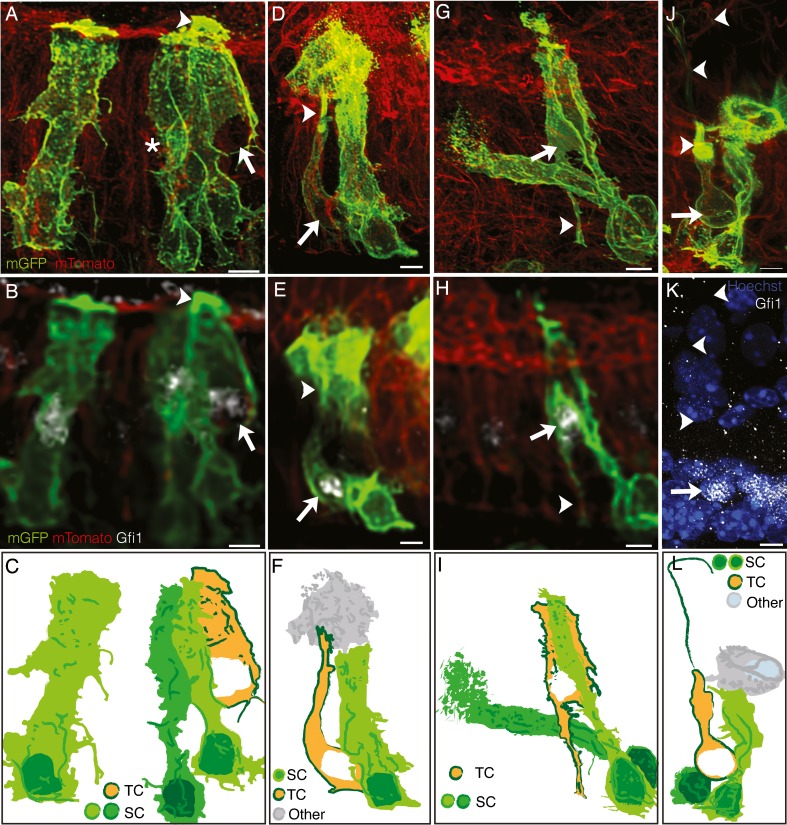
FIG. 8.
Examples of lineage traced transitional cells (TC). Two views of the cells are shown, one at 60× (A,D,G) and the other at 20× (B,E,H), due to bleaching of the Gfi1 staining at the higher magnification. All scale bars, 5 μm. A,B,C An example of a lineage traced cell representative of the majority of observed TCs. This cell was located in the hair cell layer, expressed Gfi1 (arrow), and had a taller apical mGFP labeling than surrounding support cells (SC) (arrowhead). A diagram of this cell (C) also shows several GFP+ support cells near the hair cell, one of which partially enveloped an unlabeled hair cell (dark green cell, asterisk in A). D,E,F A lineage traced cell with a morphology intermediate between a hair cell and a support cell. This cell expressed Gfi1 (arrow) and also had a taller apical mGFP labeling (arrowhead). This cell, however, was not in the hair cell layer, nor was it attached to the basement membrane. A diagram of this cell (F) also shows several GFP+ nonsensory cells (other) and a GFP+ support cell surrounding the TC. G–I Another lineage traced TC had a traditional hair cell morphology and Gfi1 expression (arrow), but also had a trailing foot attached to the basement membrane (arrowhead). A diagram of this cell (I) also shows two GFP+ support cells. J–L The last example TC had a typical hair cell morphology, a kinocilium (arrowhead in J), and Gfi1 expression (arrow in K). A diagram of this cell (L) also shows a GFP+ nonsensory cell and two GFP+ support cells surrounding the hair cell.

