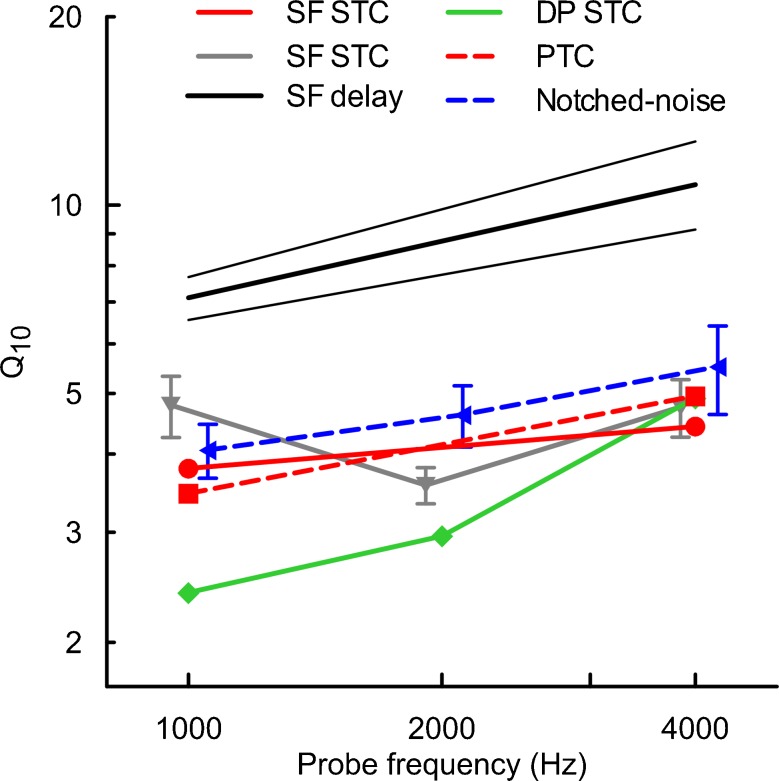
FIG. 13.
Estimates of the sharpness of tuning in humans derived from different measurement methods, with the solid lines representing objective methods and dashed lines representing the behavioral methods. Symbols represent mean Q10 values (f tip/BW10), and error bars denote ±1SE (if available). The red lines correspond to data from this report (Q10 for mean SFOAE STCs for the 10 dB SL/−6 dB SPL condition and mean PTCs are shown). Black thick line with 95 % CI (thin lines)—sharpness of tuning derived from SFOAE delays measured for a 40 dB SPL probe level (Shera et al. 2002); note: similar results were obtained by Bentsen et al. (2011); gray line with inverted triangles—SFOAE STCs recorded for a 40-dB SPL probe (Keefe et al. 2008); green line with diamonds—DPOAE STCs obtained at 10 dB SL as a function of the f 2 frequency (Gorga et al. 2011); blue line with triangles—simultaneous-masked notched-noise data obtained at 10 dB SL (Oxenham and Shera 2003). The QERB reported in the above reports were converted to Q10 (where Q10 = 0.56QERB). Data are plotted offset along the x axis for clarity.

