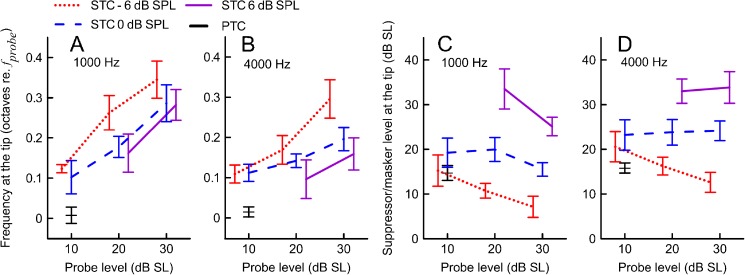
FIG. 8.
Mean suppressor frequencies and suppressor levels at the tip of SFOAE STCs at 1,000 (A and C) and 4,000 Hz (B and D) as a function of probe level. The mean data for PTCs are shown in black. Error bars denote ±1SE. Other plotting conventions as in Fig. 7.

