
Fig. 9.
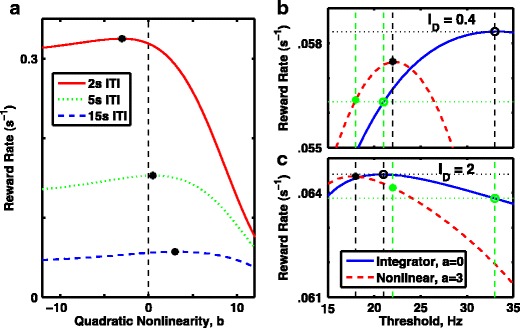
Optimal performance, measured as mean reward rate, depends on the inter-trial interval, the stimulus bias and threshold rate. a In the absence of a time limit for decisions, so threshold is always reached, reward rate is maximized with an unstable system (negative quadratic curvature), which forces faster, less-accurate responses is the inter-trial interval (ITI) is low (e.g. 2 s, red curve) but is maximized with a stable point attractor (positive curvature, indicating a barrier) if slower responses are less penalized due to a long inter-trial interval (e.g. 15 s, blue curve). A perfect integrator, exemplified by the linear system (curvature = 0, vertical dashed line) is optimal at a single, specific inter-trial interval, slightly less than 5 s (green line). All curves are with D = 400Hz 2 s −1, with stimulus bias, i D = 20 and with threshold, θ = 20Hz. Red solid curve: ITI = 2 s. Green dot-dashed curve: ITI = 5 s. Blue dashed curve: ITI = 15 s. The absence of time limit ensures an absence of “undecided” trials. b, c Reward rate with an ITI of 15 s for the perfect integrator (blue solid curve) and a barrier model (red dashed curve) as a function of static threshold. b Standard stimulus bias, i D = 20. c Large stimulus bias, i D = 50, leads to lower value for the optimal threshold rate. b, c Blue solid curve, linear integrator with a = 0; red dashed curve, nonlinear model with a = 3; black open circle, performance of linear integrator when threshold is optimal; black asterisk, performance of nonlinear model when threshold is optimal; green open circle, performance of linear integrator when threshold is optimal for the alternative stimulus; green asterisk, performance of nonlinear model when threshold is optimal for the other stimulus