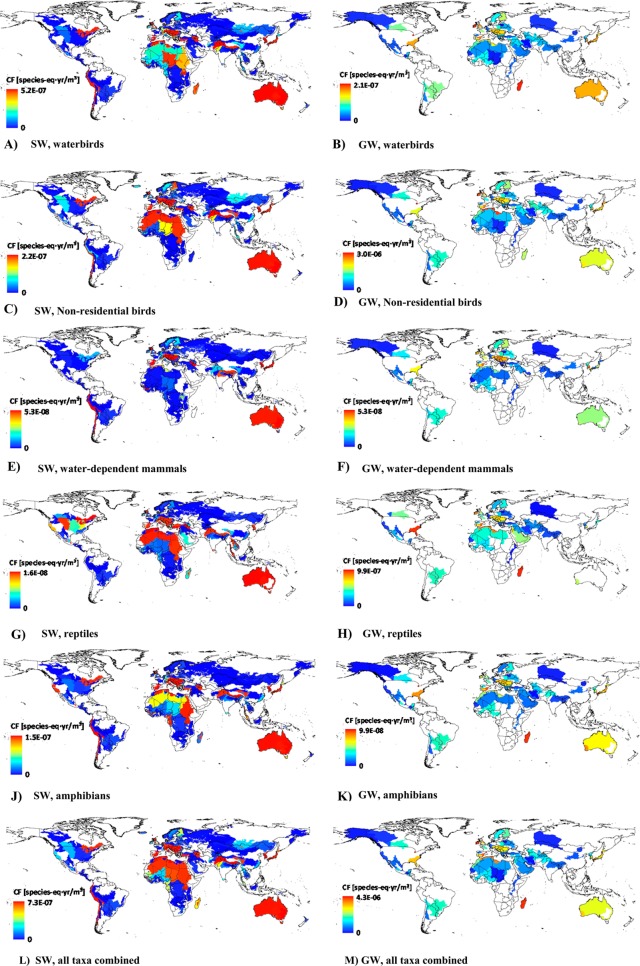
Figure 1.
Global maps of CFs, with indications of wetland type (SW, surface water-fed, GW – groundwater-fed) and taxon. White areas are areas where no impact on a Ramsar wetland is perceived. Base map with country boundaries adapted from ref (43). (A) CFs for waterbirds and SW consumption in SW-fed wetlands. (B) CFs for waterbirds and GW consumption in GW-fed wetlands. (C) CFs for nonresidential birds and SW consumption in SW-fed wetlands. (D) CFs for nonresidential birds and GW consumption in groundwater-fed wetlands. (E) CFs for water-dependent mammals and SW consumption in SW-fed wetlands. (F) CFs for water-dependent mammals and GW consumption in GW-fed wetlands. (G) CFs for wetland reptiles and SW consumption in SW-fed wetlands. (H) CFs for wetland reptiles and GW consumption in GW-fed wetlands. (J) CFs for amphibians and SW consumption in SW-fed wetlands. (K) CFs for amphibians and GW consumption in GW-fed wetlands.( L) CFs for all taxa combined and SW consumption in SW-fed wetlands. (M) CFs for all taxa combined and GW consumption in GW-fed wetlands. Note that the CFs for groundwater-fed wetlands should only be used for marginal changes or cases studies with good data coverage, due to the uncertainty in the FFs.17

