
Fig. 6.
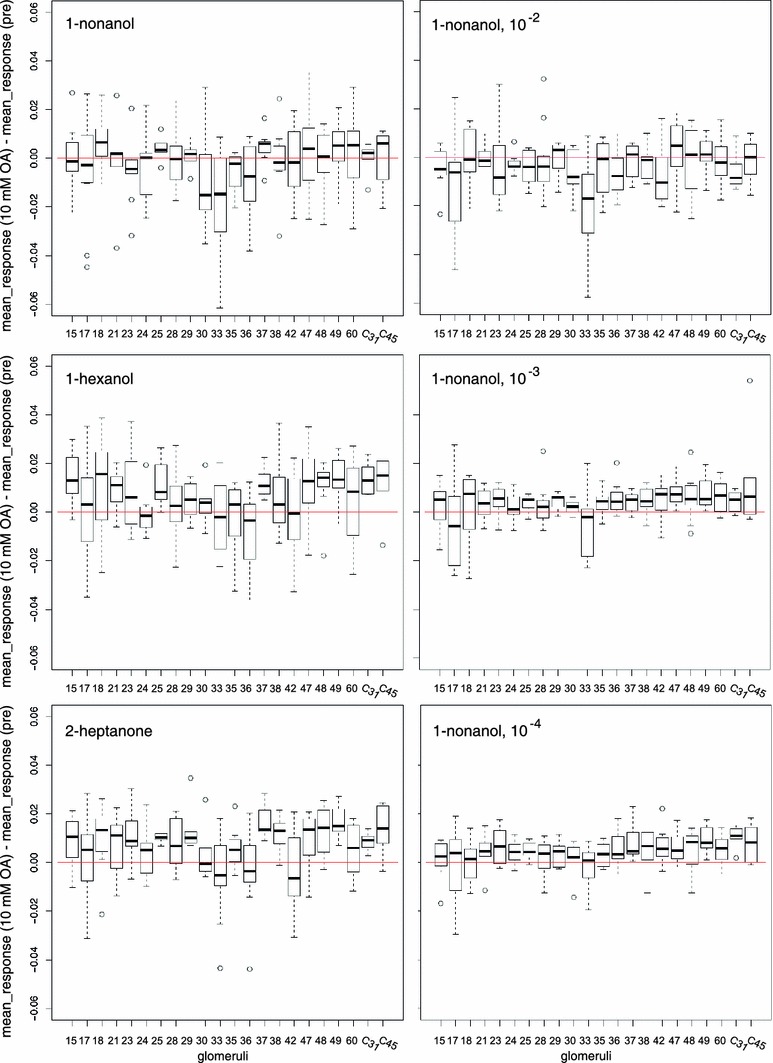
The octopamine effect is variable across animals. The OA-mediated change in odor response (OA treatment response minus pretreatment response) resolved for different odors: 1-nonanol, 1-hexanol, 2-heptanone and different concentrations: 1-nonanol (separate measurement set), 10−2, 10−3 and 10−4. Note that for all odors, OA-induced changes vary widely, with both positive and negative effects. This indicates that there is a high variability across animals, suggesting a role of individual network plasticity. Box plot with mean and quartiles, whiskers indicate the range (min–max or 1.5 × interquartile distance, whichever smaller), circles are values outside this range (outliers). For all odors, we show the same 189 glomeruli. Number of animals differs for glomerulus: mean = 8.59, SD = 2.72, required minimum for analysis was n = 5 animals