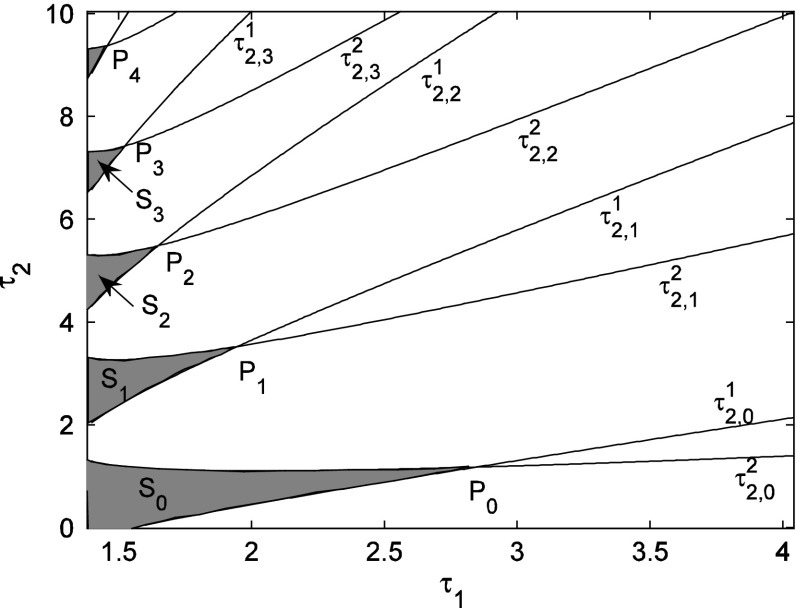
Fig. 4.
Variation of the critical delay values τ
2 with τ
1 in the (τ
1, τ
2) parameter plane for the fixed parameters as a
1 = −6, a
2 = 2.5, a
3 = 2.5, a
4 = −6, P = 0.4 and Q = 0.4, respectively, where  denote the stability regions of equilibrium point (x
0, y
0) and Pj, j = 0, 1, 2, … are the double Hopf bifurcation points

