
Fig. 3. Correlation between IGF2 LOI and IGF2 expression.
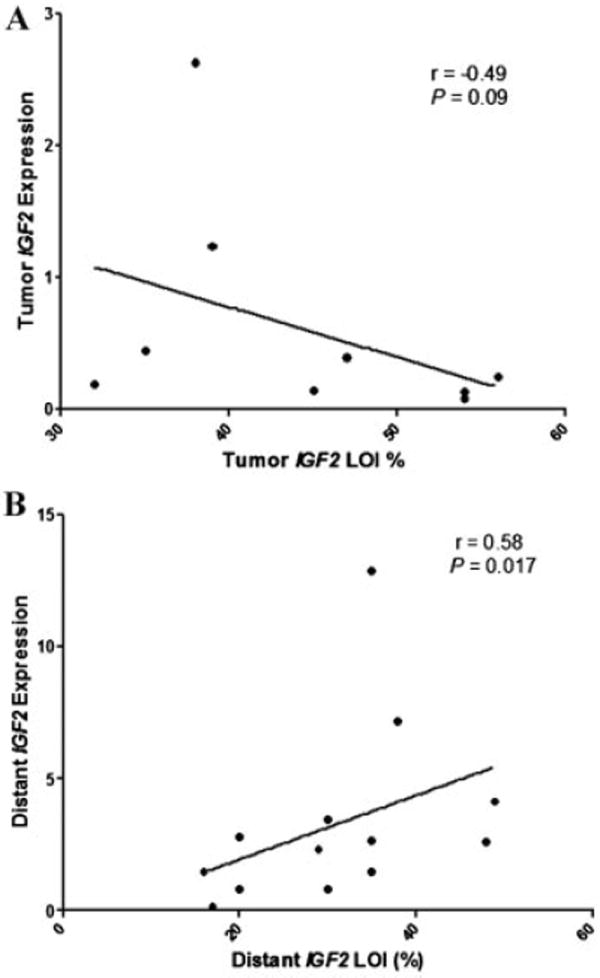
Gene expression was analyzed using qPCR and FLuPE utilized for imprinting analyses. Correlation analyses were performed using Spearman’s correlation. (A) Tumor samples (r = −0.49, P = 0.09), (B) distant TA tissues (r = 0.58, P = 0.017).