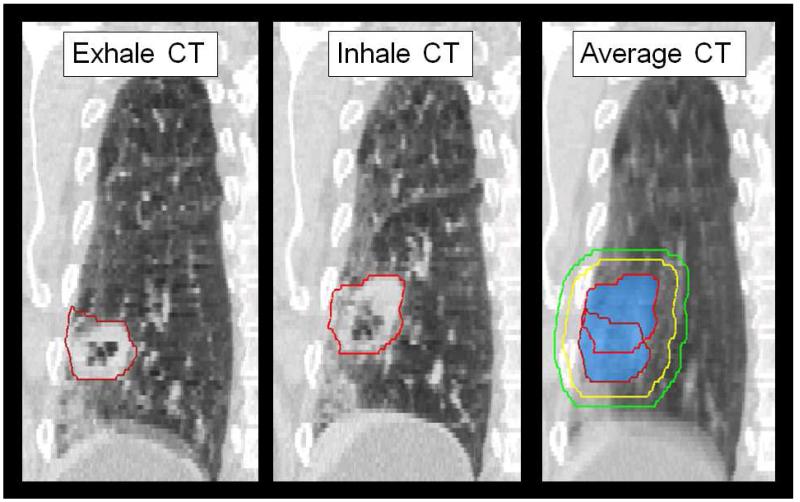
Figure 1.
For each patient, the GTV (red) were delineated on the four-dimensional (4D) CT phases. The union of GTV volumes throughout respiration created the iGTV (blue colorwash). Volume structures were created to account for microscopic disease (ITV, yellow) and setup uncertainty (PTV, green). Contour data is then sent to PSPT and IMRT treatment planning software for plan creation, as per the clinical protocol specifications in Table 1.

