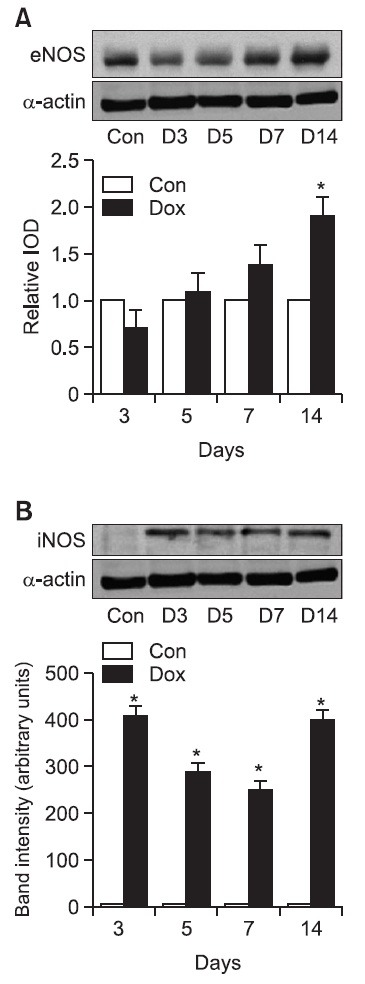
Fig. 4. Western blot analysis of eNOS of expression and iNOS expression in heart tissue. Representative western blot images from eNOS (upper panel) and iNOS in Dox-treated rats at various time interval after completion of a doxorubicin treatment period. Quantification of eNOS protein expression in ventricles from rats treated with Dox (lower panel). Results were presented as relative IOD (integrated optical density) compared with control group. (A) Results of eNOS are mean ± SD. Con of eNOS indicates control group. *p<0.05 versus control group. (B) Results of iNOS are mean ± SD. Con of iNOS indicates control group. *p<0.01 versus control group: (A) eNOS: A (0 day), B (3 days after), C (5 Day after), D (7 day after), E (14 days after), (B) iNOS: A (0 day), B (3 days after), C (5 Day after), D (7 day after), E (14 days after).