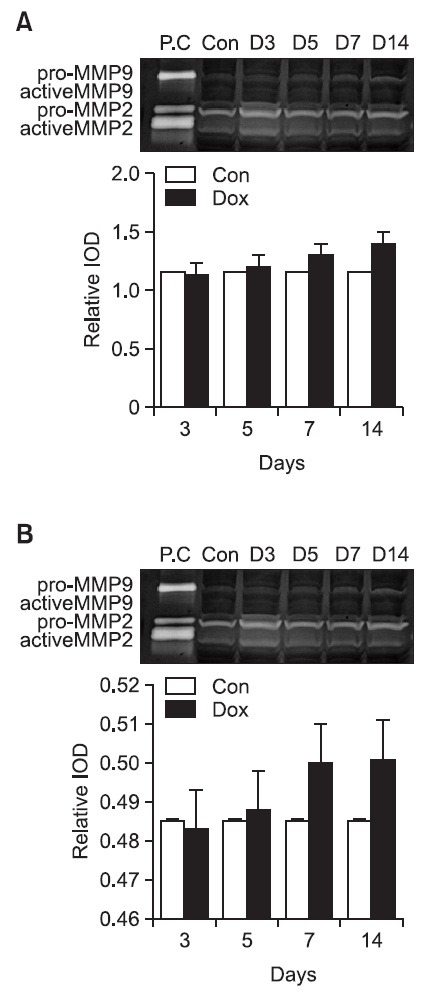
Fig. 8. Gelatin zymographic analysis of MMP 2 expression and MMP 9 expression in DOX-treated heart tissue. Representative zymogram showed the presence of gelatinolytic activities in each group. (A) MMP 2 expression and (B) MMP 9 in DOX-treated heart tissue. Bar graphs showing densinometric quantitation of specific gelatinolytic activities in each group. D3, D5, D7 and D14 indicate the day after completion of a doxorubicin treatment period. Results are mean ± SD. C denotes normal group; PC indicates positive control, HT1080 cell.