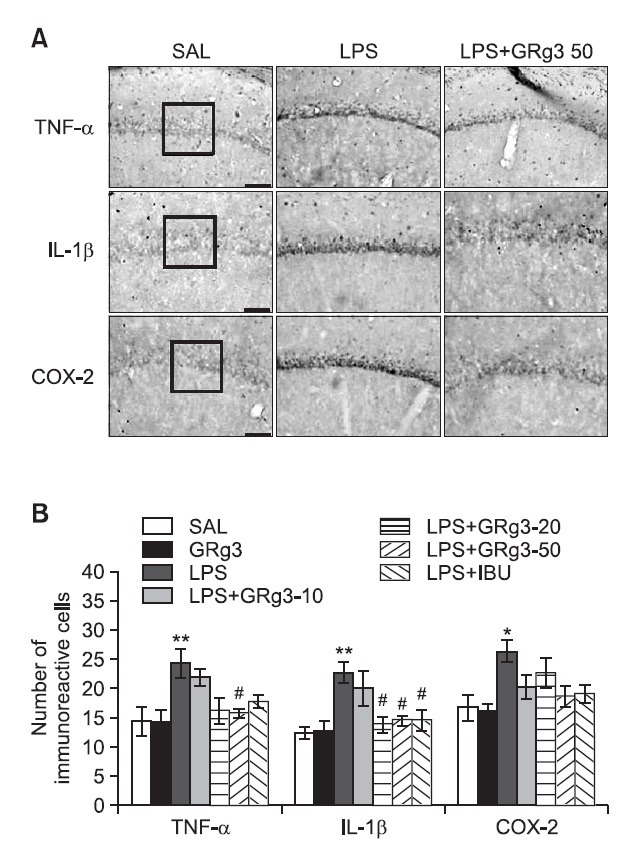
Fig. 6. Effects of GRg3 on the mean number of tumor necrosis factor-α (TNF-α)-, interleukin-1β (IL-1β)-, and cyclooxygenase-2 (COX-2)-stained hippocampal areas after the Morris water maze test. Representative photographs and the relative percentage values are indicated in (A) and (B), respectively. Sections were cut coronally at 30 μm. Scale bar indicates 50 μm. *p<0.05 and **p<0.01 vs. SAL group; #p<0.05 vs. LPS group.