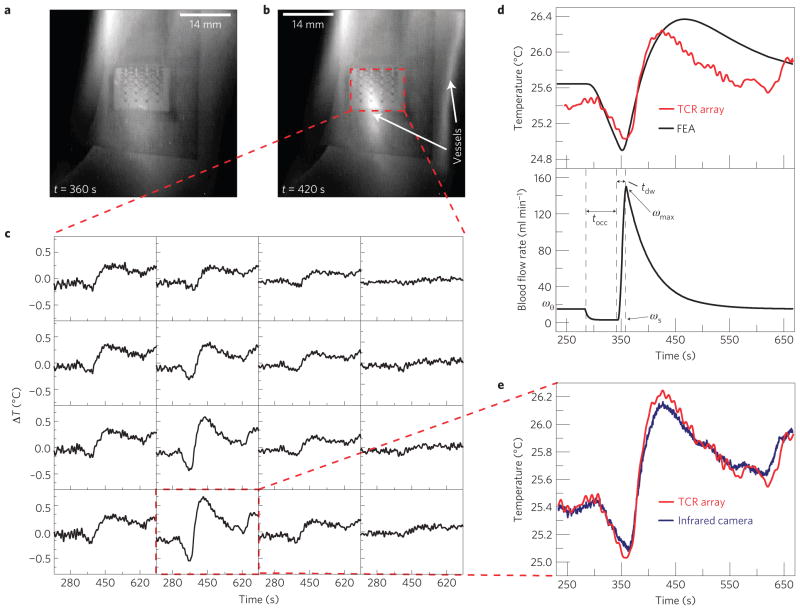
Figure 4. Epidermal electronics for a reactive hyperaemia test.
a,b, Infrared image of a 4× 4 TCR sensor array on the wrist during an occlusion test at t = 360 s (corresponding to the end of a 60 s period of occlusion, during which there is minimal blood flow; a) and t = 420 s (corresponding to the peak in temperature rise after releasing the occlusion; b). c, Measured temperature changes during occlusion (t = 300–360 s) and after occlusion (t = 360–660 s) recorded by each of the 16 sensors in the 4× 4 TCR sensor array. d, FEA of the temperature rise at the surface of the skin above the ulnar artery during the occlusion experiment as compared with experimental data (top) and blood flow rate through the ulnar artery used in the FEA (bottom). The key parameters characterizing the temporal variation of blood flow rate include: the occlusion time (tocc) = 60 s as used in the experiment; time-to-peak-flow (tdw) = 15 s; baseline flow rate (ω0) = 15 ml min−1; occluded flow rate (ωs) = 3 ml min−1; peak flow rate (ωmax) = 150 ml min−1. e, Temperature measured by the single sensor that showed the largest temperature change during the occlusion test.

