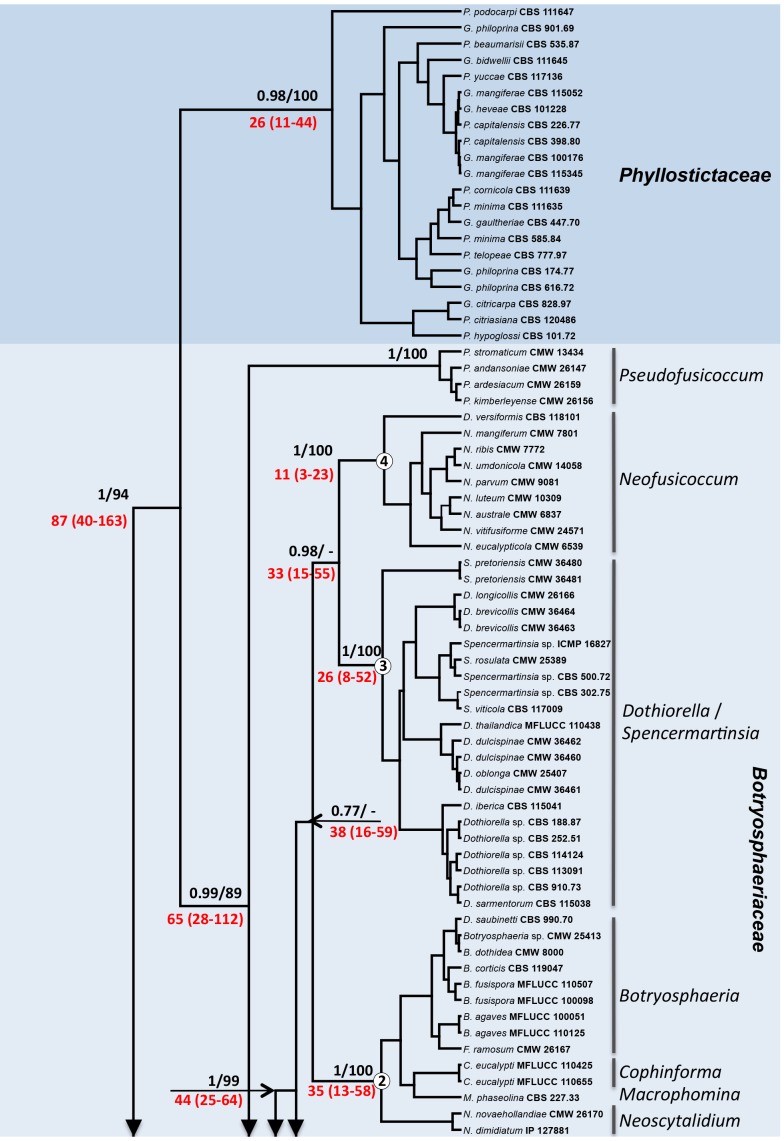
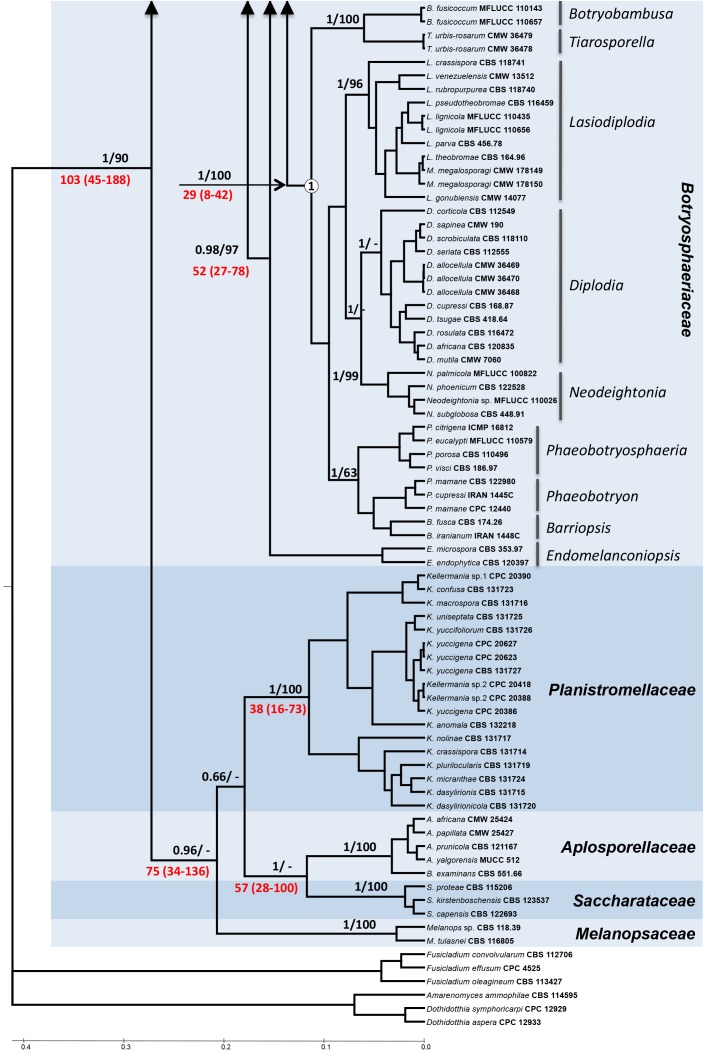
Fig. 1.
Phylogenetic relationships of the Botryosphaeriales using Bayesian reconstruction and six gene portions (LSU, SSU, ITS, EF1, BT and mtSSU). Numbers above branches indicate bootstrap values/posterior probabilities. Numbers highlighted in red below branches indicate estimated dates in million years with the 95 % Highest Posterior Density interval given in brackets. Clades 1-4 in the Botryosphaeriaceae are indicated by a circled number on the corresponding node.


