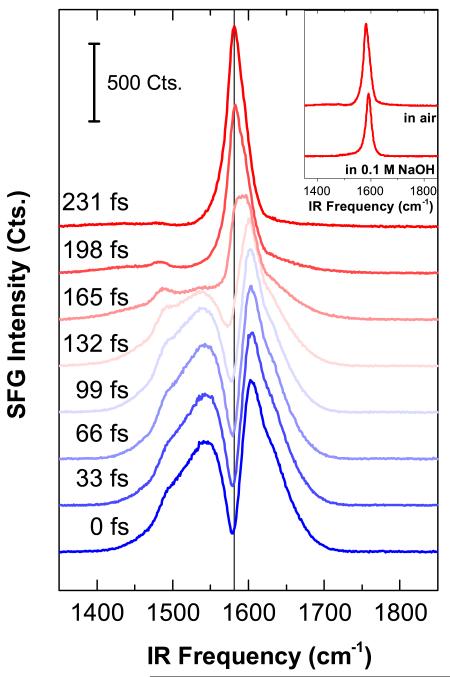
Fig. 3.
(Color online) SFG spectra recorded at around 1600 cm−1 at different delay times between IR and 800 nm beams. The vertical line at peak maximum is a guide to the eye for comparing resonant and non-resonant signals. The inset shows background suppressed SFG spectra (231 fs) in air and in 0.1 M NaOH.

