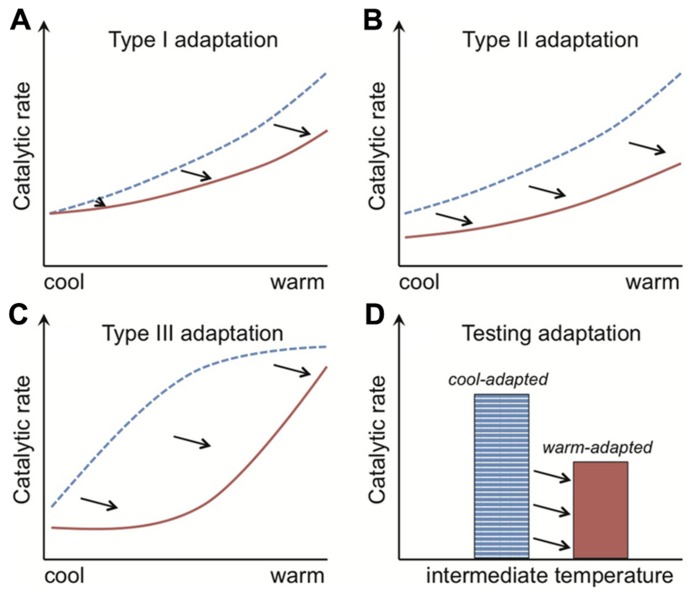
FIGURE 3.
The rate of enzyme-mediated reactions are shifted right along the temperature axis for organisms adapted to warmer conditions. The catalytic rates of both cool- and warm-adapted enzymes (blue dotted and red solid lines, respectively) increase with temperature. Their temperature response pattern, however, differs. With type I adaptation (A) the temperature sensitivity (i.e., Q10) of warm-adapted enzymes is lower, and with type II adaptation (B) this sensitivity is unchanged but the absolute catalytic rates are consistently lower across the temperature gradient. Type III adaptation (C) represents a mix of type I and II adaptation and is associated with shifts from cold- to warm-adapted communities, where adaptation leads to separation of the temperature response into discrete, bell-shaped curves (see Figure 5). The commonality in pattern across the type I to III responses is that the temperature optima of warm-adapted enzymes, individuals, populations or communities is shifted right of the cold-adapted lines. The black arrows depict this “right shift.” The classical test for thermal adaptation (D) involves measuring process rates at an intermediate temperature (i.e., between cool and warm), where types I–III adaptation would always produce lower rates for the warm-adapted communities, assuming variables such as substrate supply are non-limiting and rates are standardized by organism biomass.

