
Figure 4. Receiver-operating characteristic curves for type 2 diabetes.
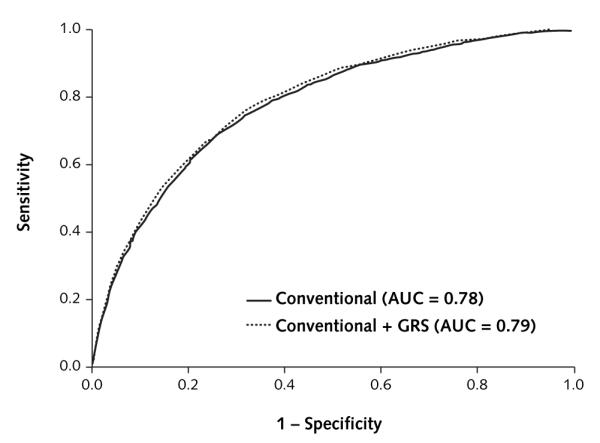
The curves are based on logistic regression models incorporating conventional risk factors (age, sex, body mass index, family history of diabetes, smoking, alcohol intake, and physical activity) with and without the count GRS. AUC = area under the curve; GRS = genetic risk score.