
Fig. 6.
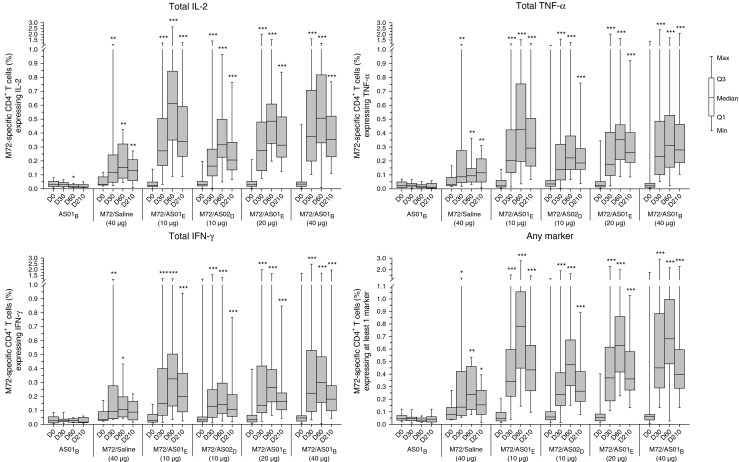
Frequencies of total immune-marker expressing M72-specific CD4+ T cells. Blood samples were obtained prior to each vaccination (D0 and D30), and at 1 and 6 months post the second vaccination (D60 and D210). Data are reported as the percentages of M72-specific CD4+ T cells expressing any immune marker among IFN-γ, IL-2, TNF-α and CD40L (‘any marker’) or at least IL-2, TNF-α or IFN-γ among all CD4+ T cells, with first and third quartiles, and the minimum/maximum values measured. Magnitudes of the immune responses post vaccination (D30, D60 and D210) versus D0 were compared using the Wilcoxon signed rank test. Values were considered significantly different if p ≤ 0.05, as indicated by * for p ≤ 0.05, ** for p < 0.01 or *** for p < 0.001