
Fig. 7.
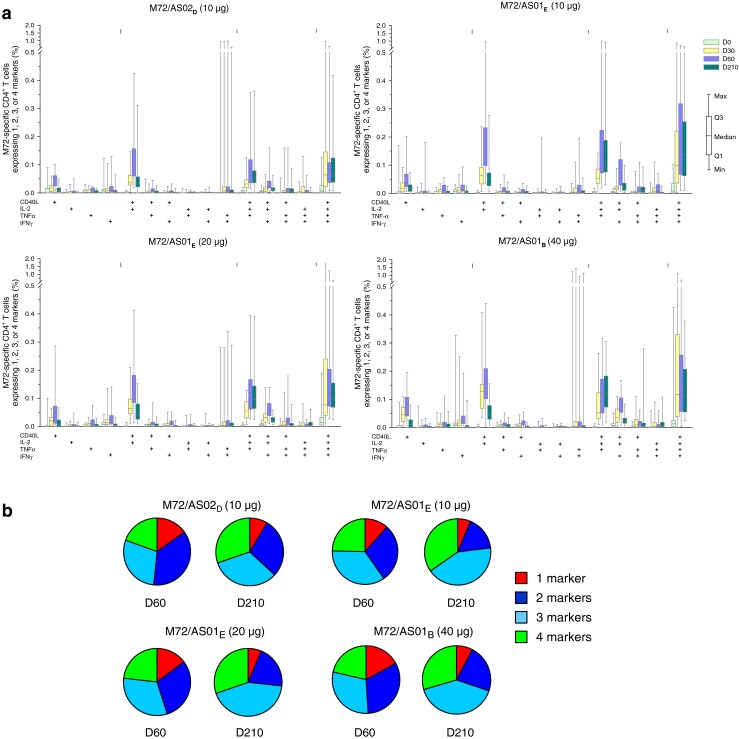
Polyfunctional profiles of M72-specific CD4+ T cells expressing any combination of immune markers elicited by the adjuvanted M72 vaccine groups. Blood samples were obtained prior to each vaccination (D0 and D30), and at 1 and 6 months post the second vaccination (D60 and D210). a Phenotypes of M72-specific CD4+ T cells expressing (after in vitro stimulation) single markers and any combination of IFN-γ, IL-2, TNF-α and CD40L. Box-and-whiskers plots represent the percentages of M72-specific CD4+ T cells, with first and third quartiles, and the minimum/maximum values measured. b Pie charts represent the mean proportions of cells expressing (after in vitro stimulation) single markers and any combination of IFN-γ, IL-2, TNF-α and CD40L marker-positive CD4+ T cells out of the total immune-marker expressing CD4+ T-cell response, at Days 60 and 210