
Fig. 6.
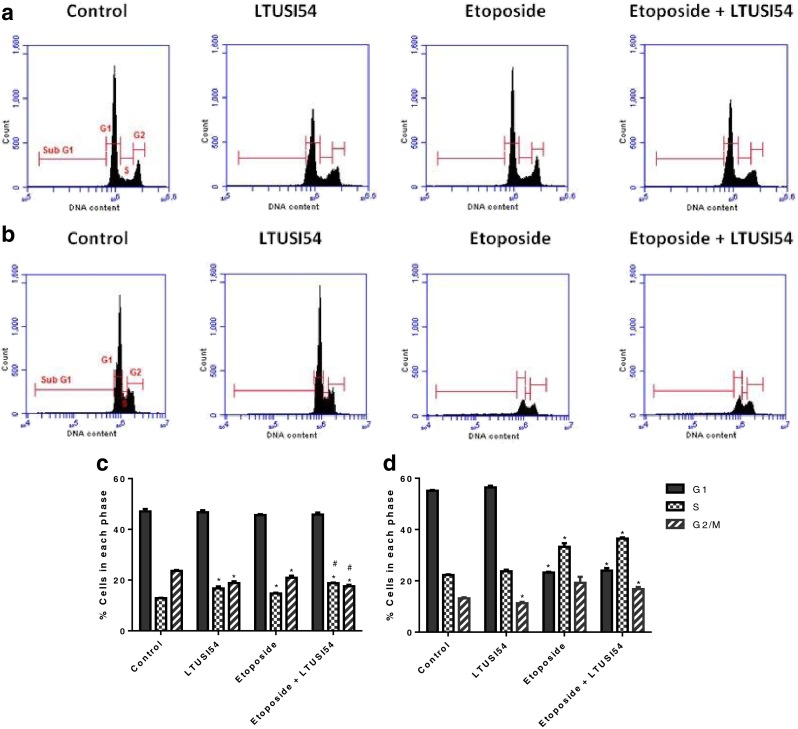
Cell cycle profiles from flow cytometry analysis of HeLa cells treated with Etoposide in the presence and absence of LTUSI54 for (a) 4 h alone and (b) when allowed to recover for 2 days. Percent of cells in each phase of the cell cycle following (c) 4 h treatment alone and (d) following 2 days recovery time in recovery media containing LTUSI54. Graphs indicate mean ± SEM of three independent experiments. (Asterisk) Indicates treatments significantly different to control, (number sign) indicates combination treatments significantly different to Etoposide alone treatment