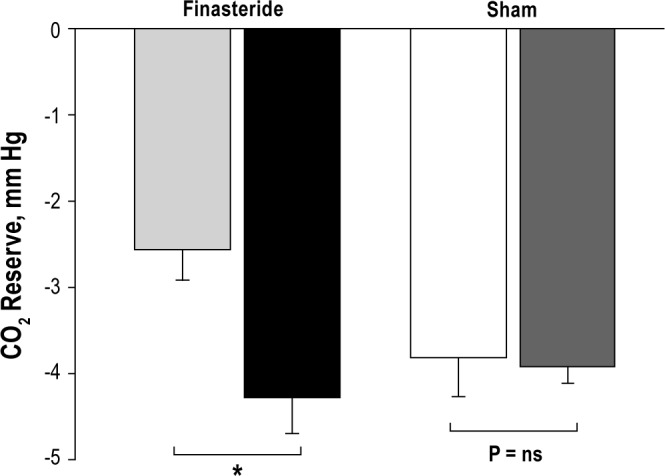
Figure 3.

Grouped data comparing the CO2 reserve in the finasteride and sham groups. The bars represent averaged data for baseline and follow-up experimental nights (first 2 bars: light gray and black bars, respectively) in the finasteride group, and the baseline and follow-up nights (next 2 bars: white and dark gray, respectively) in the sham group. There was a significant increase in the CO2 reserve, *P = 0.003 in the finasteride group with no significant change in the sham group.
