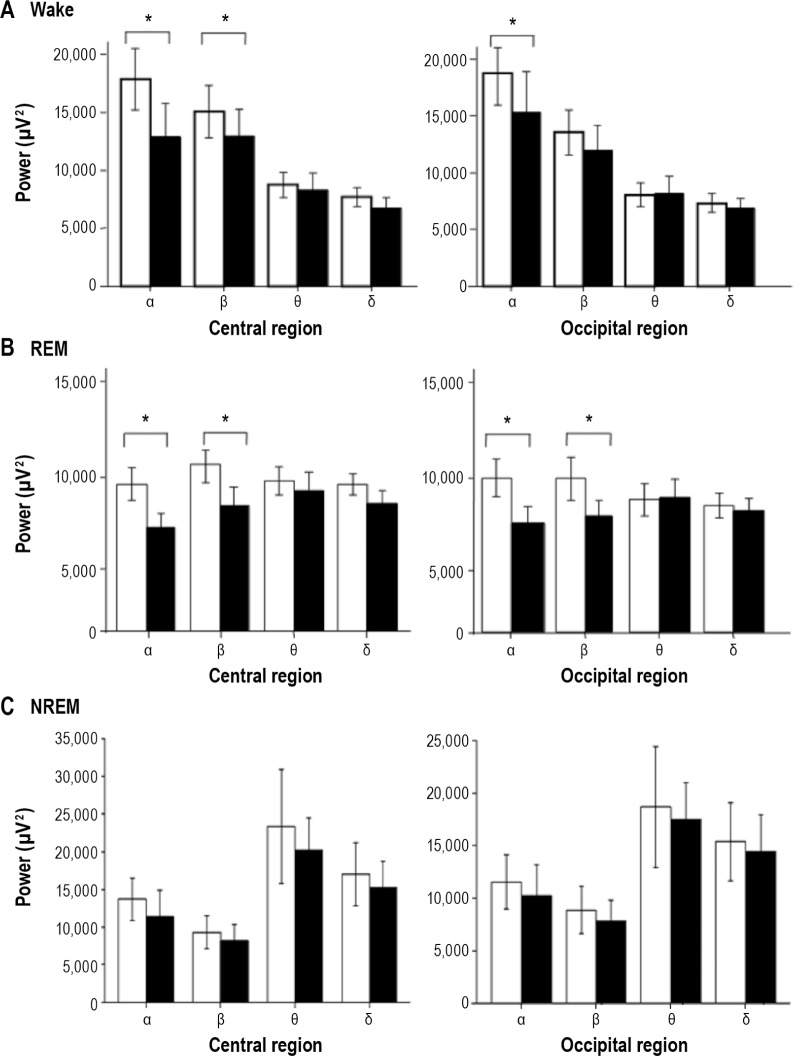
Figure 2.
Comparison of electroencephalographic spectral power during wake, rapid eye movement sleep, and non-rapid eye movement sleep in patients with idiopathic rapid eye movement sleep behavior disorder and control patients. Black bars show data for the younger rapid eye movement sleep behavior disorder group. White bars show data for the age-matched control group. *P < 0.05, values are expressed as mean ± standard deviation.

