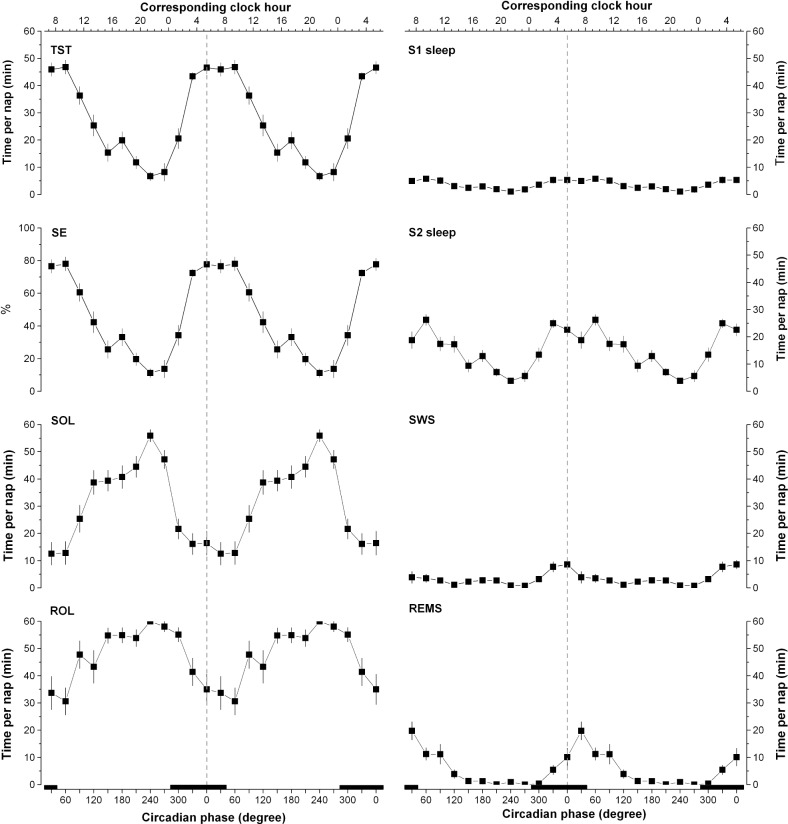
Figure 1.
Circadian variation of polysomnographic (PSG) sleep measures obtained throughout the ultradian sleep-wake cycle procedure. TST, total sleep time; SE, sleep efficiency; SOL, sleep onset latency; REMS, rapid-eye movement sleep; ROL, REM onset latency; S1, stage 1 sleep; S2, stage 2 sleep; SWS, slow wave sleep. Results were folded every 360° and repeated over two circadian cycles for illustrative purposes. A nonlinear mixed model was applied to individual subjects' 30°-binned data using nlmixed SAS procedure. All PSG measures had a significant circadian amplitude (amplitude significantly different from 0, P < 0.05). The vertical dotted line corresponds to the core body temperature (CBT) minimum. Bottom X axes represent circadian phase and top X axes represent the corresponding clock time (CBT minimum at 0° = 05:23). Black bars along the X axes represent the time of projected habitual nocturnal sleep episodes. All values are means ± standard error of the mean.

