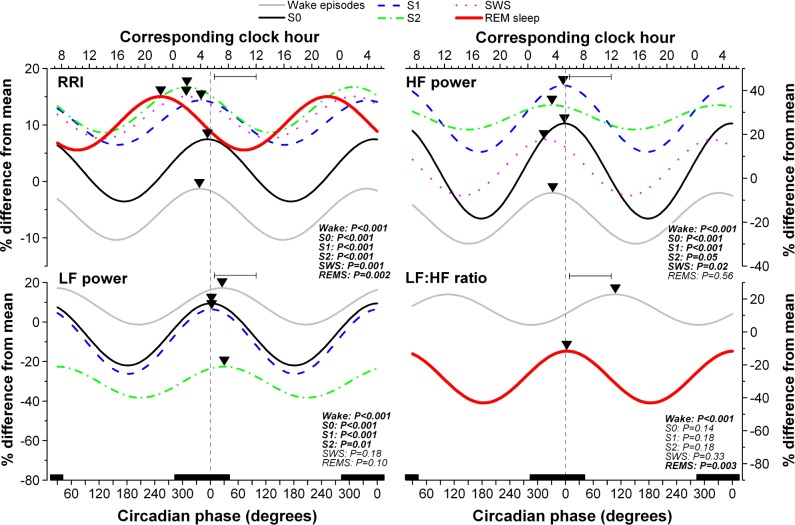
Figure 3.
Circadian variation of consecutive R-R intervals (RRIs, top left panel), high-frequency (HF) power (top right panel), low frequency (LF) power (lower left panel) and the LF:HF ratio (lower right panel) during wake episodes and vigilance states of nap episodes (i.e., S0, wake during nap episode; S1, stage 1 sleep; S2, stage 2 sleep; SWS, slow wave sleep; REMS, rapid eye movement sleep). The Y axis of each HRV component represents the % deviation from the subject's mean. Results were folded every 360° and repeated over two circadian cycles for illustrative purposes. A nonlinear mixed model was applied to individual subjects' data using nlmixed SAS procedure based on equation S1. Only the significant fitted cosine functions are shown for each state. P values are reported for each state. The vertical dotted line corresponds to the minimum core body temperature (CBT). Bottom X axes represent circadian phase and top X axes represent the corresponding clock time (CBT minimum at 0° = 05:23). Black bars along the X axes represent the time of projected habitual nocturnal sleep episodes. Inverted triangles illustrate the acrophase of each significant rhythm. Peak time of adverse cardiovascular events (based on information in Muller1) are illustrated by the horizontal bar within each panel.

