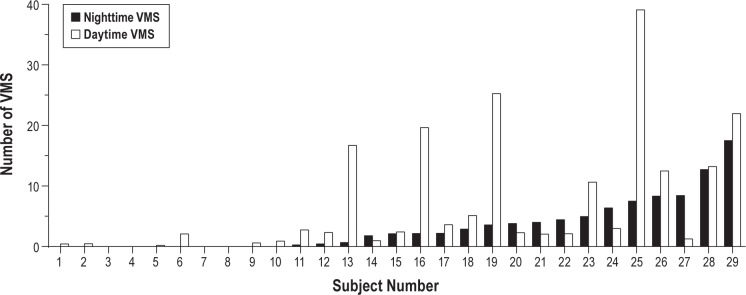
Figure 1.

Distribution of total number of nighttime and daytime vasomotor symptoms (VMS) reported by each individual subject (n = 29) over the 1-mo follow-up, showing interindividual differences in the proportion of VMS that were reported at night. Each pair of black and white vertical bars represents an individual subject.
