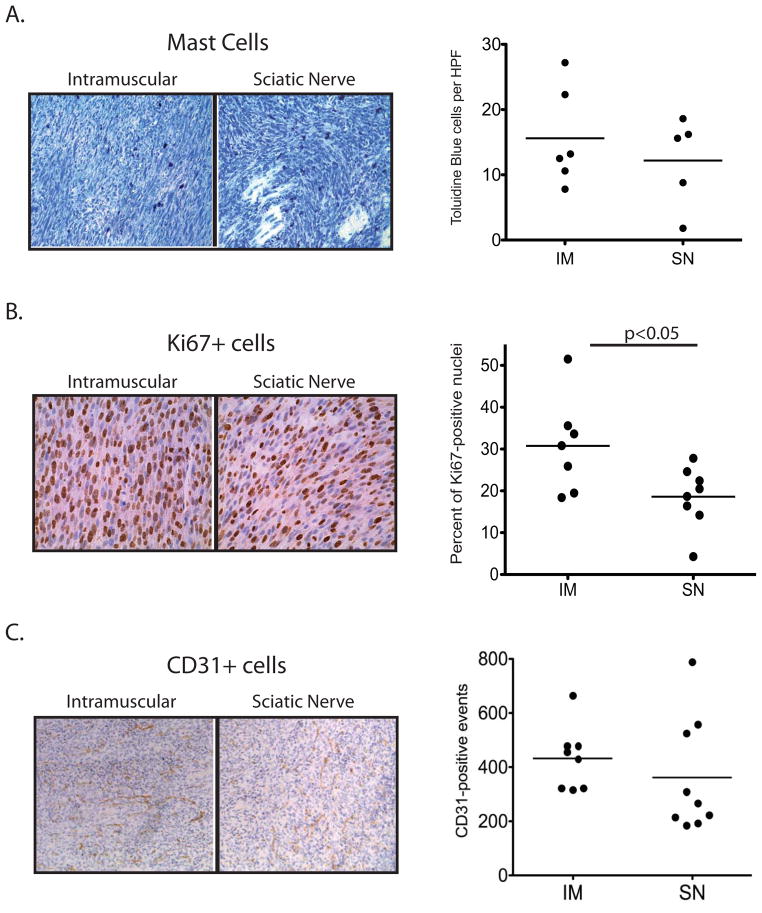
Figure 2. Comparison of NF1-deleted sarcomas initiated by intramuscular (IM) or intra-sciatic nerve (SN) injection of Ad-Cre.
A) Mast cells, visualized by toludine blue, infiltrate both IM and SN tumors at similar levels. Quantification represents the average number of cells per 20x field, with 10 fields counted per tumor. B) Ki67+ proliferative index is higher in IM tumors compared to SN tumors (p<0.05). Quantification represents the percentage of Ki67+ cells normalized to total nuclei per 40x field, with 6 fields counted per tumor. C) Microvessel density, visualized by CD31+ cells, is similar between IM and SN tumors. Quantification represents the average number of cells per 20x field, with 6 fields counted per tumor.

