
Figure 3.
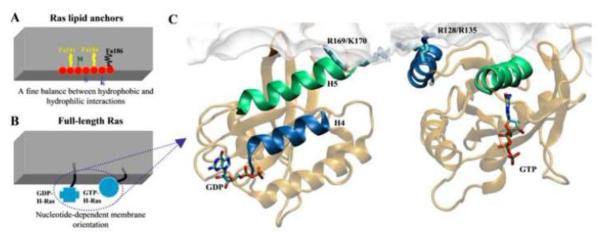
Schematic summary of the main results from atomistic MD simulations of Ras lipid anchors (A) and the full-length H-Ras (B & C). Fig A highlights the different organization of the backbone and side chains in the H-Ras lipid anchor (which has two palmitoyl (Pa) and a farnesyl (Fa) modifications). The schematic in Fig B summarizes the two different membrane-orientations of the catalytic domain observed during the simulations. Fig C shows the molecular details of GDP- and GTP-bound H-ras in a DMPC bilayer, highlighting the close contact of residues Arg169 and Lys170 of the linker and Arg128 and Arg135 of helix-4 with the bilayer, respectively. Note the different orientation of helix-4 (dark blue) and helix-5 (green) with respect to the membrane plane. Selected side chains and the nucleotide are shown in licorice with nitrogen in blue, oxygen in red, carbon in cyan and phosphate in ochre. A hypothetical bilayer surface (A and B) and a monolayer from simulations (C) are shown in grey.