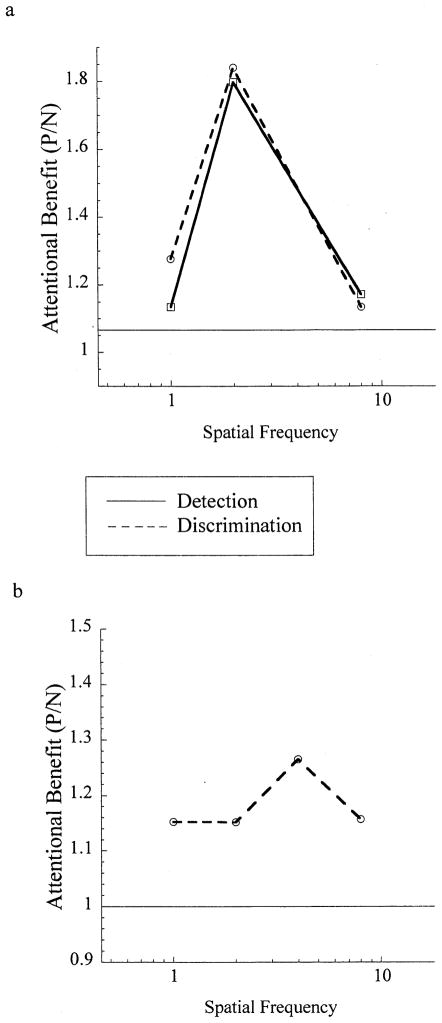
Fig. 6.
To quantify the attentional effect on contrast sensitivity, we plotted the ratio of percent correct in the peripheral cued condition to the neutral cued condition (P/N). Values above 1 illustrate an attentional benefit. The functions depict both the averages of observers ratios for (a) Experiment 3a (vertical versus horizontal stimuli; n=2); and (b) Experiment 3b (tilted stimuli; n=4).

