
Figure 5.
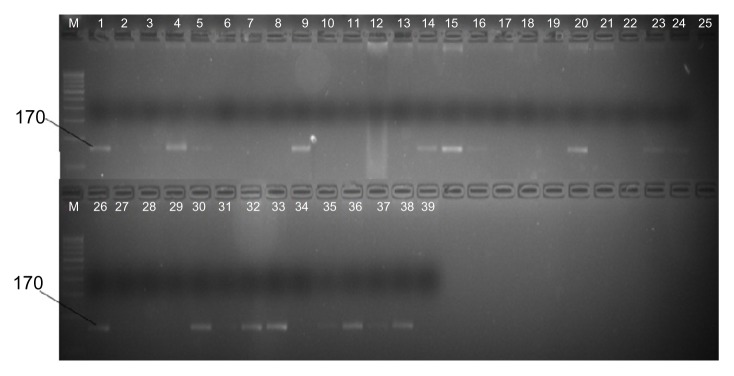
PCR analysis using the SNP marker. List of genotype was mentioned in Supplementary Table 2. The size of the amplification product is shown on the left. Absence of a band indicates the specific sequence is absent in wheat genotype. Lane 39 is a negative control, which used H2O as the template.