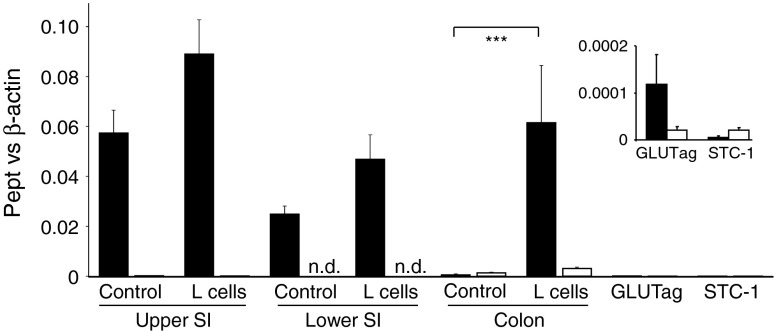
Fig. 4.
Pept1, but not Pept2, is expressed in L cells. Expression of Pept1 (black bars) and Pept2 (white bars) mRNA relative to β-actin, as assessed by RT-PCR in FACS-sorted L and non-L cells (control) from the upper and lower small intestine (SI) and colon, and GLUTag and STC-1 model cell lines. Data are presented as the geometric mean and upper SEM of the data (n ≥ 3 each). Significance comparisons between L and non-L cells were calculated by ANOVA with post hoc Bonferroni analysis on the ΔCt data, ***p < 0.001. The inset shows the data for the cell lines on an amplified y-axis scale

