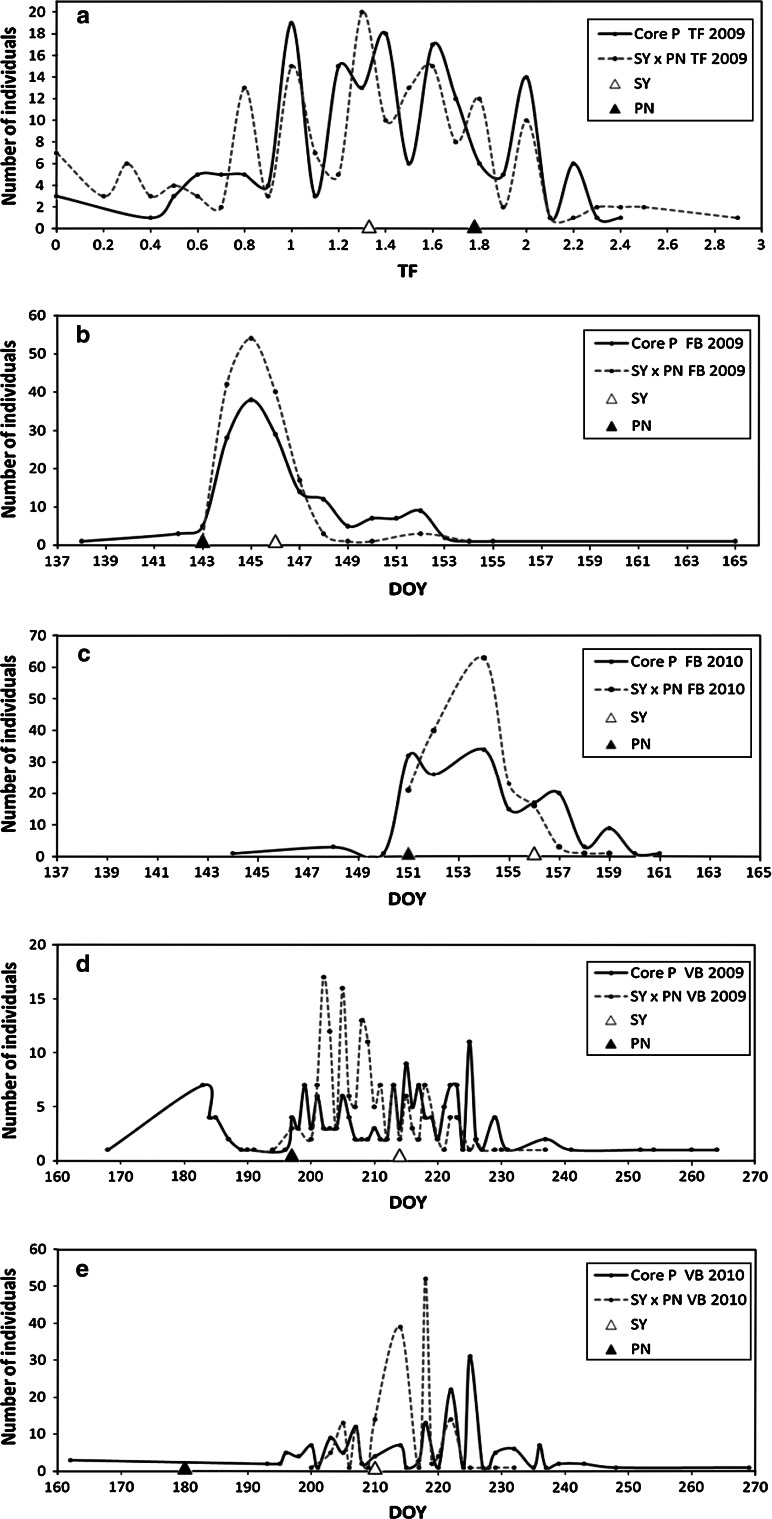
Fig. 1.
Comparison of phenotypic variability in two grapevine populations: the “phenological core collection” (Core P) and the progeny of a cross between Syrah and Pinot Noir (SY × PN). Exemplary frequency plots for: a total fertility index (TF) in 2009 and b–e the timing of flowering beginning (FB) and véraison beginning (VB) in 2009 and 2010, respectively; DOY day of year in Julian days

