Fig. 1.

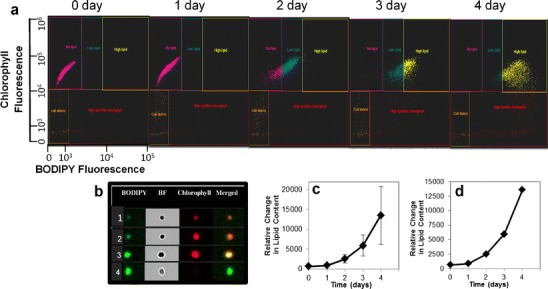
Imaging flow cytometry analysis of TAG accumulation in wild-type cells resulting from N and P limitation. a Scatter plots of chlorophyll and BODIPY fluorescence on different days after placing cells in induction medium. Five distinct subpopulations of cells were identified based on their microscopic appearance, which are delineated by different colored gates. b Representative images from four of the five subpopulations (the fifth was dead cells or debris). Subpopulations are 1 low lipid, 2 intermediate lipid, 3 high lipid with chlorophyll, and 4 high lipid with no chlorophyll. c, d Plot of means of BODIPY fluorescence. Error bars represent standard deviation (c) or standard error (d)
