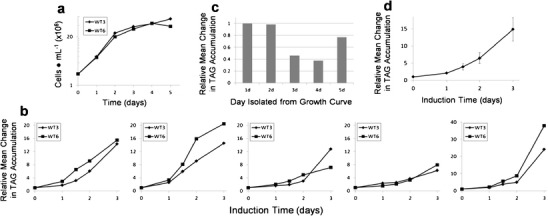
Fig. 2.

TAG accumulation of wild-type cells at different culture stages. a Growth curve of two wild-type cultures (WT3 and WT6) grown through exponential into stationary phase and aliquots isolated on days 1–5 of the culture. b Plots of relative changes in TAG levels from aliquots that were subjected to TAG induction under N and P limitation, monitored by BODIPY fluorescence over 3 days. c Plot of the relative change in the means of TAG accumulation over the 3-day period for WT3 and WT6 on each day isolated from the growth experiment. d Mean and average standard deviation for each time point for two wild-type replicates in eight separate TAG induction experiments
