Fig. 8.

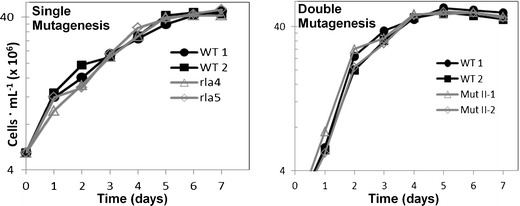
Comparing growth of single mutant and double mutant cells with wild-type cells. Two WT control cultures (unsorted) included in each analysis are shown in black and filled symbols and open and gray symbols are single and double mutant cells

Comparing growth of single mutant and double mutant cells with wild-type cells. Two WT control cultures (unsorted) included in each analysis are shown in black and filled symbols and open and gray symbols are single and double mutant cells