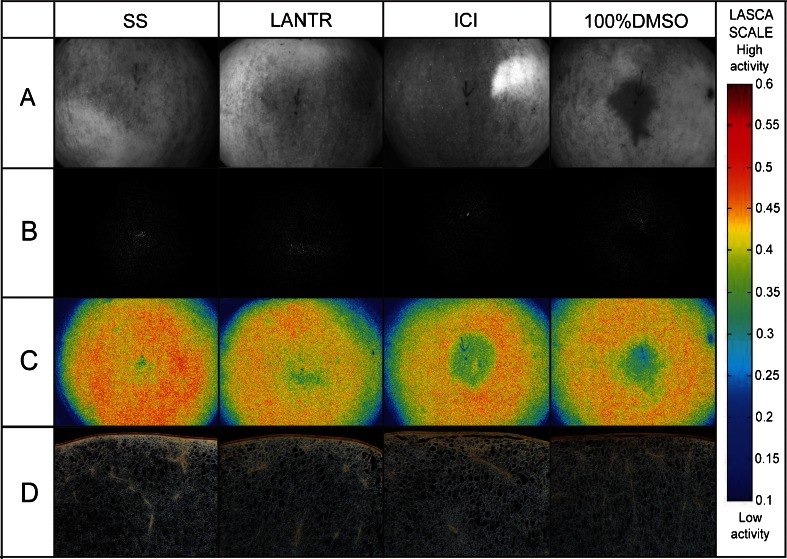
Fig. 4.
Examples of: A apples 600 min after injection and just before recording a biospeckle patterns for LASCA, B biospeckle pattern recorded for LASCA analysis. C results of LASCA analysis, D micrographs of apple tissues close to the place of injection. Scale for LASCA analysis is presented beside (values on the scale are not equal with BA derived from the cross-correlation method). Width of images shown in the rows A-C is 5 cm and in d 8 mm

