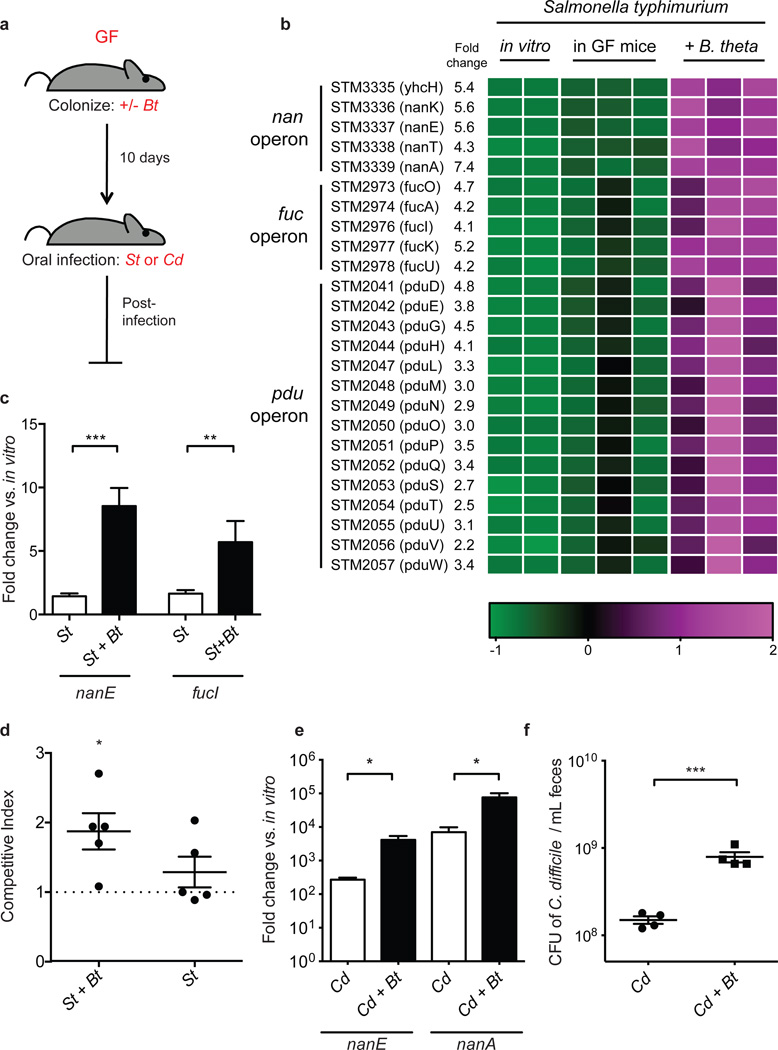
Figure 1. Bt facilitates S. typhimurium and C. difficile carbohydrate utilization during emergence.
a, Schematic of mouse infection experiments. Germ-free, GF; B. thetaiotaomicron, Bt; S. typhimurium, St; C. difficile, Cd.
b, S. typhimurium operons displaying significant differences in gene expression levels in vivo in the presence and absence of Bt, 5 days post-infection. Colors indicate the deviation of each gene's signal above (purple) and below (green) its mean expression value across all six in vivo samples and duplicate in vitro growths conducted in minimal medium.
c, Induction of S. typhimurium nanE and fucI in cecal contents 1 day post-infection relative to growth in LB broth [n = 9 and 4 for St and St+Bt, respectively].
d, Competitive index of wild-type St/St-ΔnanAΔfucI in Bt-monoassociated (St+Bt) and ex-germ-free (St) mice 1 day post-infection. Horizontal bars indicate the geometric means of CI values, and individual CI values are represented with dots [n = 5/group].
e, Induction of C. difficile nan genes in cecal contents 3 days post-infection relative to growth in minimal medium containing 0.5% glucose [n = 4/group].
f, C. difficile density in feces 1 day post-infection [n = 4/group].
Error bars indicate SEM.

