
Figure 2. Along the auditory pathway, neurons' response distributions become increasingly independent of the level of background noise.
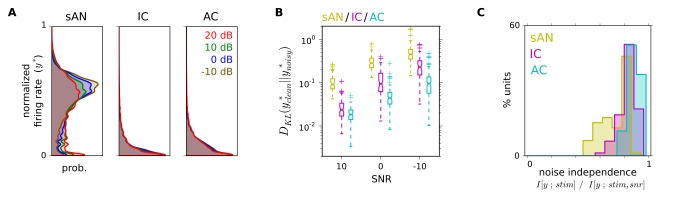
(A) Average distribution of normalized firing rates by location/SNR. For each unit,  , where
  is the firing rate. This shows that the average response distribution within the population changes less with noise in higher auditory centers. (B) Kullback–Leibler divergence between individual units' normalized firing-rate distributions evoked from clean sounds and evoked from noisy sounds. Smaller values indicate that firing rate distributions were similar. This shows that individual neurons' response distributions change less with noise in higher auditory centers. (C) Statistical independence of stimulus-conditioned response distributions
  to the background noise level (see Materials and Methods for details of metric). Lower values indicate that response distributions were highly dependent on the stimulus SNR; a value of 1 indicates that response distributions were completely independent of the stimulus SNR. Median values of 0.80/0.84/0.88 for sAN/IC/AC (
 , pairwise rank-sums tests).