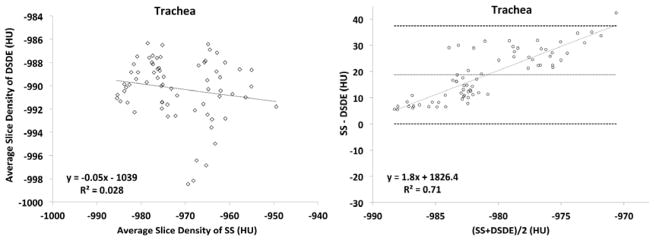
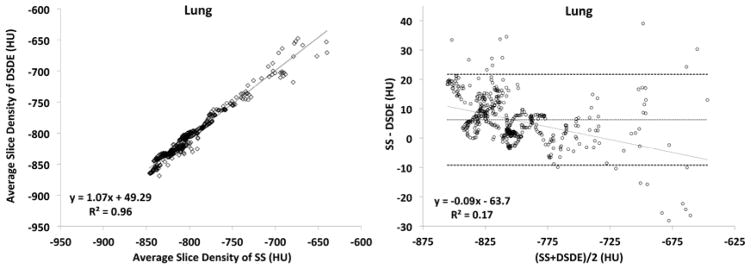
Figure 3.


A&B. Linear regression plots of average slice densities comparing SS and DSDE at 80 kVp are shown for the in-vivo trachea (3A, left-panel) and lung parenchyma (3B, left panel) from an example swine. Similarly, Bland-Altman plots show the relationship of the mean of the average slice densities from the SS and DSDE scans vs. the difference between values obtained from the two scanning modes operated at 80 kVp. Data obtained from the trachea (3A, right-panel) and lung parenchyma (3B, right-panel) of the same swine as depicted in the left panels.
