Figure 7.
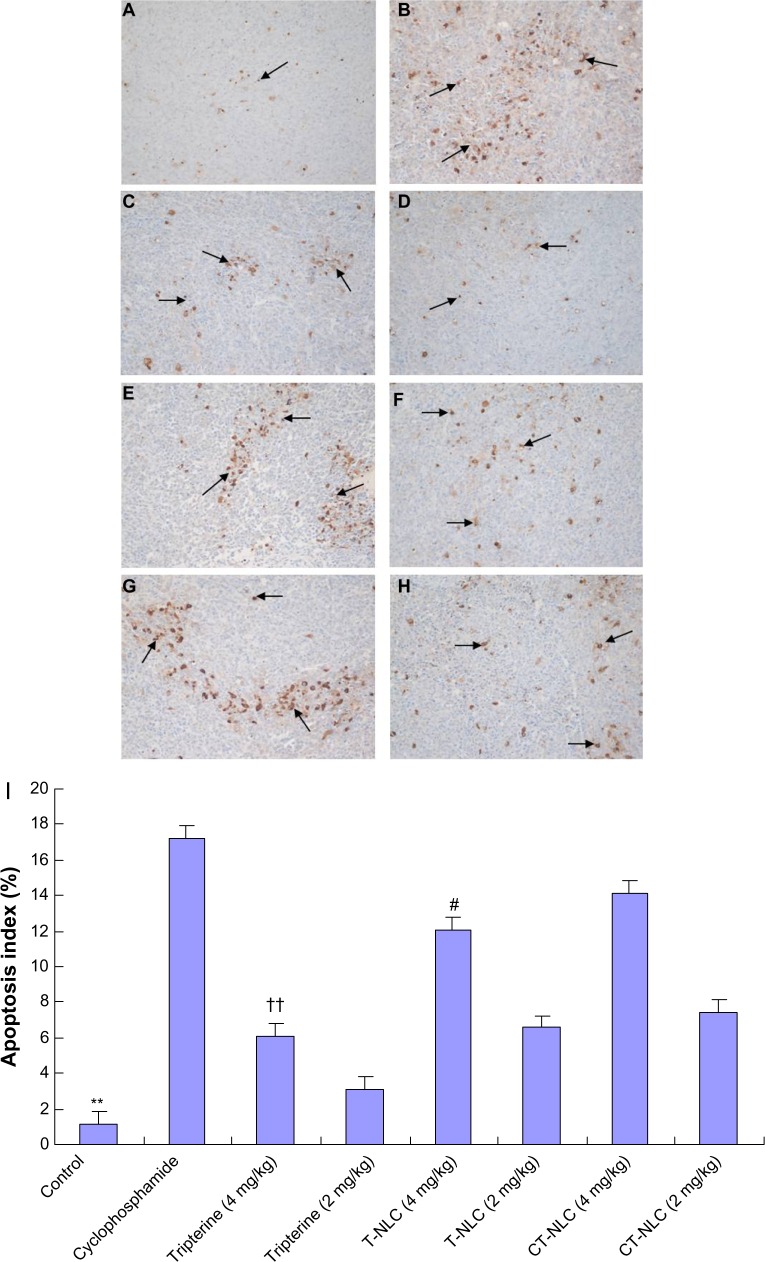
Effects of CT-NLC on tumor apoptosis. Representative images of TUNEL staining for (A) saline control group, (B) cyclophosphamide group, (C) tripterine suspension group 4 mg/kg, (D) tripterine suspension group 2 mg/kg, (E) T-NLC group 4 mg/kg, (F) T-NLC group 2 mg/kg, (G) CT-NLC group 4 mg/kg, and (H) CT-NLC group 2 mg/kg are shown. Positive cells marked by black arrows. Magnification 400×. The apoptosis index is shown as a percentage of TUNEL-positive cells (I).
Notes: Data represent the mean ± standard deviation (n=6). **P<0.01 versus control; ††P<0.01 versus tripterine 4 mg/kg; #P<0.05 versus T-NLC 4 mg/kg.
Abbreviations: T-NLC, tripterine-loaded nanostructured lipid carriers; CT-NLC, cell-penetrating peptide-coated T-NLC; TUNEL, terminal deoxynucleotidyl transferase (TdT)-mediated dUTP nick end labeling.

