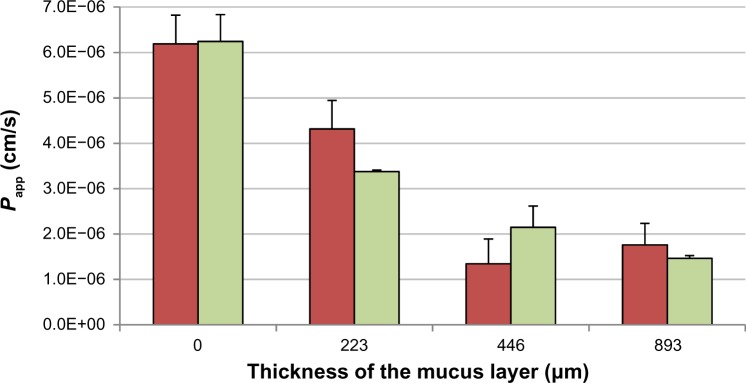
Figure 5.

Comparison of Taxol® (16.8 μg/mL) diffusion after 4 hours through mucus batch 1 (red bars) and mucus batch 2 (green bars).
Note: Data are shown as mean ± standard error of the mean (n=3).
Abbreviation:Papp, apparent permeability.

Comparison of Taxol® (16.8 μg/mL) diffusion after 4 hours through mucus batch 1 (red bars) and mucus batch 2 (green bars).
Note: Data are shown as mean ± standard error of the mean (n=3).
Abbreviation:Papp, apparent permeability.