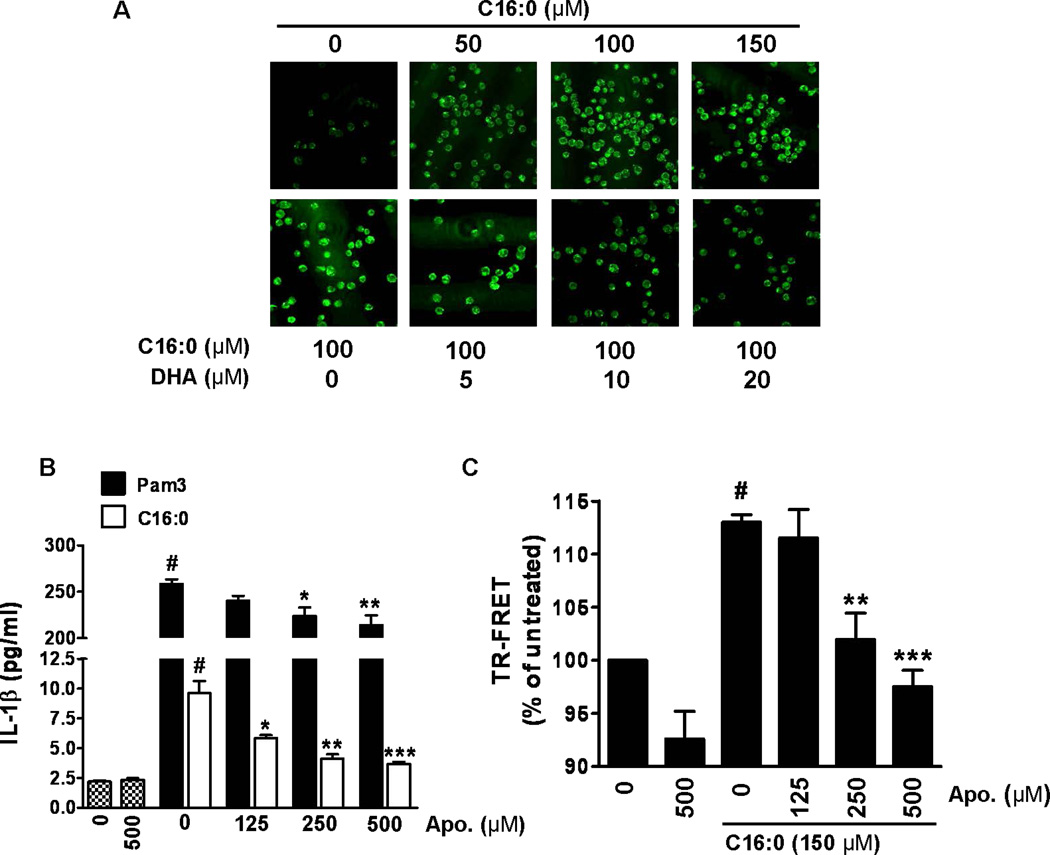
Figure 7. Palmitic acid induces but DHA inhibits ROS production.
(A) THP-1 cells were serum starved in 0.25% FBS-RPMI-1640 for 12 hours. Cells were incubated with CM-H2DCFDA (10 uM) for 30 minutes then pretreated with or without DHA for 1 hour prior to treatment with C16:0 for 20 minutes. Cells were fixed and imaged by confocal microscopy. (B) Serum starved THP-1 cells were incubated with apocynin for 1 hour then treated with C16:0 (150 µM) or Pam3CSK4 (10 ng/ml) for 24 hours. Cell culture supernatants were analyzed for IL-1β by ELISA. Data are expressed as mean ± SEM of three independent experiments. Significance was determined by ANOVA (#P < 0.001 significantly different from untreated, *P < 0.05, **P < 0.01, ***P < 0.001 significantly different from C16:0 or Pam3). (C) THP-1 cells were serum starved with fluorophore-labeled TLR2 and TLR1 antibodies for 12 hours. Cells were incubated with apocynin (125, 250, 500 µM) for one hour then treated with C16:0 (150 µM) for 10 minutes. TR-FRET data are presented as mean percentages of untreated cells ± SEM and were calculated from at least three independent experiments. Significance was determined by ANOVA (#P < 0.001 significantly different from untreated, **P < 0.01, ***P < 0.001 significantly different from C16:0).

