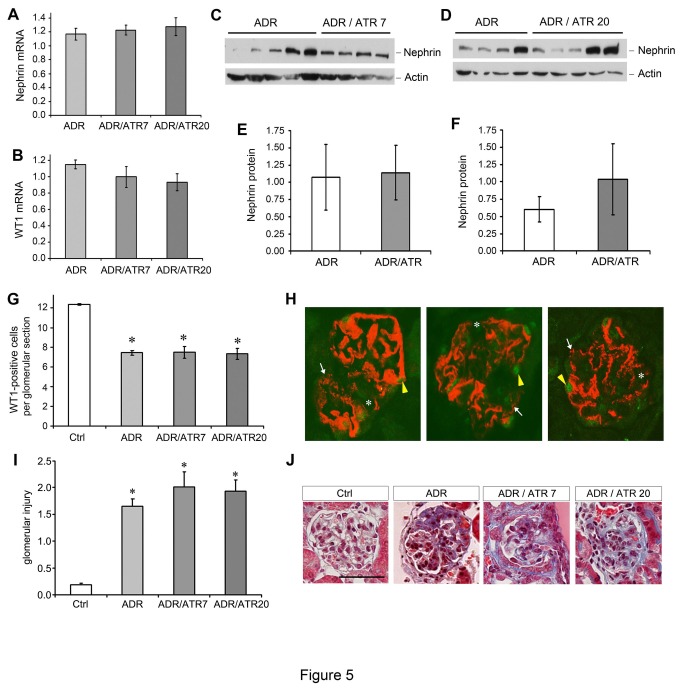
Figure 5. Atrasentan does not ameliorate established podocyte injury in adriamycin nephropathy.
Mice were treated as in Figure 4A. (A, B) qRT-PCR analysis showed nephrin (A) and WT1 (B) mRNA expression. ADR, adriamycin alone; ADR/ATR7, adriamycin-treated mice that also received atrasentan at 7 mg/kg; ADR/ATR20, adriamycin-treated mice that also received atrasentan at 20 mg/kg. (C-F) Western blots and densitometry for nephrin expression in different groups as indicated. (C and E) Atrasentan at 7 mg/kg; (D and F) Atrasentan at 20 mg/kg. (G) WT1-positive nuclei in 20 glomerular sections from each animal (n=3 for each group) were counted as in Figure 3. *P < 0.05 compared to control group only. (H) Representative glomerulus from mouse treated with adriamycin and sacrificed at 35 days (left panel). Atrasentan at a dose of 7 mg/kg (middle panel) or 20 mg/kg (right panel) did not improve the loss of linear staining for nephrin (white arrows), the areas of complete nephrin disruption (asterisk), or the decrease in WT1-positive nuclei (yellow arrowheads). (I) Histologic scoring of 20 glomeruli per animal (n=4 for Ctrl group and n=5 for all other groups) reveals no difference when atrasentan is added to adriamycin treatment. * P < 0.05 compared to control group only. (J) Representative images of glomeruli from Ctrl and treatment groups, as indicated. Note a lack of improvement in glomerular histology with atrasentan treatment. Scale bar equal 50 μm.

