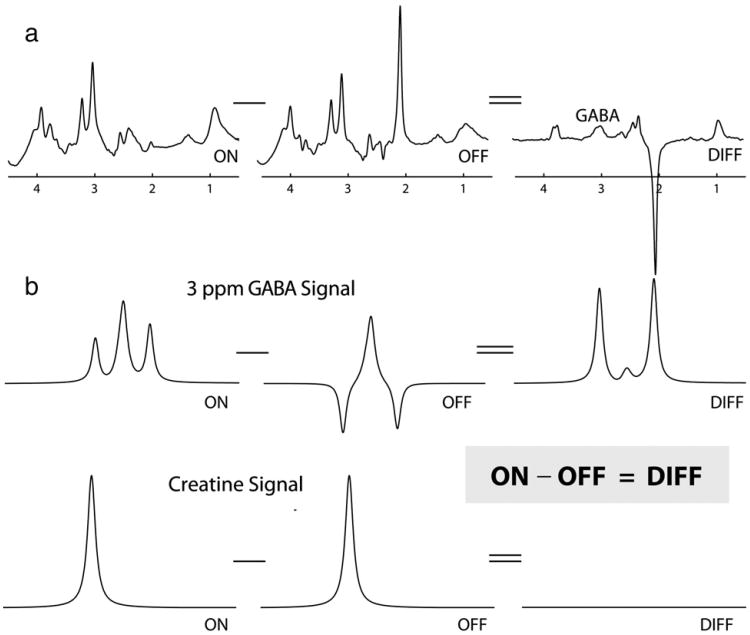
Fig. 1.
Schematic diagram of MEGA-PRESS editing for GABA. (a) Editing pulses applied at 1.9 ppm modulate the shape of the GABA signals at 3 ppm (b). Subtracting scans acquired without these pulses (labeled OFF) from scans acquired with the editing pulses (ON) removes overlying creatine signals from the edited spectrum, revealing the GABA signal in the difference spectrum (labeled DIFF). (b) shows the effect of editing pulses on signals at 3 ppm only.

