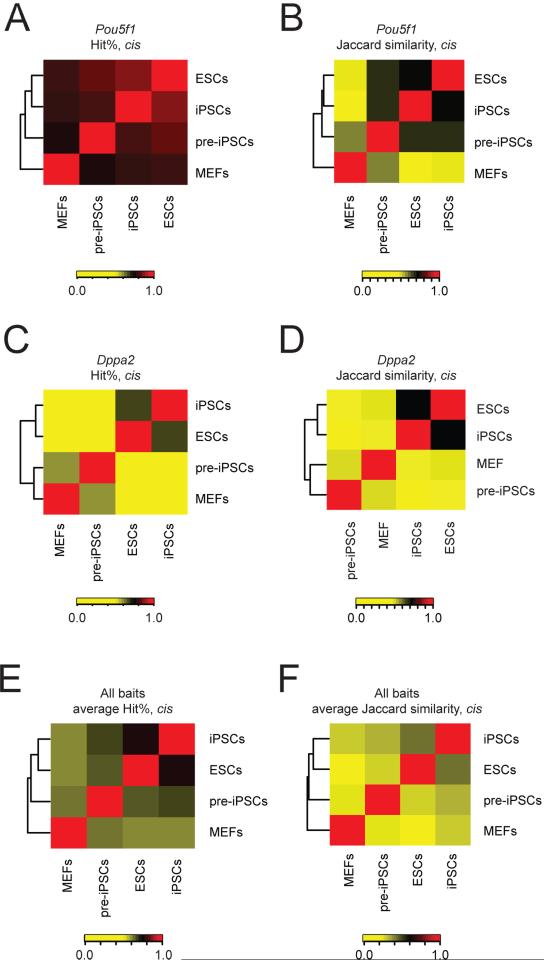
Figure 2. Long-range chromatin contacts change during differentiation and reprogramming of somatic cells to iPSCs.
A, Unsupervised hierarchical clustering of Spearman rank correlation values of the hit% within 200kb windows along the cis chromosome (chr17) for Pou5f1 4C-seq-derived interactomes in ESCs, iPSCs, pre-iPSCs, and MEFs. Color key = Spearman rho values.
B, Unsupervised hierarchical clustering of Jaccard similarity coefficients for the overlap of interacting domains of the Pou5f1 bait region in cis, between ESCs, iPSCs, pre-iPSCs, and MEFs. Color key = Jaccard similarity values.
C, As in (A), except for the Dppa2 bait.
D, As in (B), except for the Dppa2 bait.
E, As in (A), except averaged across eight different bait loci (Pou5f1, Stk35, 1700067P10Rik, Nfia, Dppa3, Rhbdd1, Hoxa10, and Dppa2).
F, As in (B), except averaged for the eight different bait loci named in (E).
See also Figure S2.

