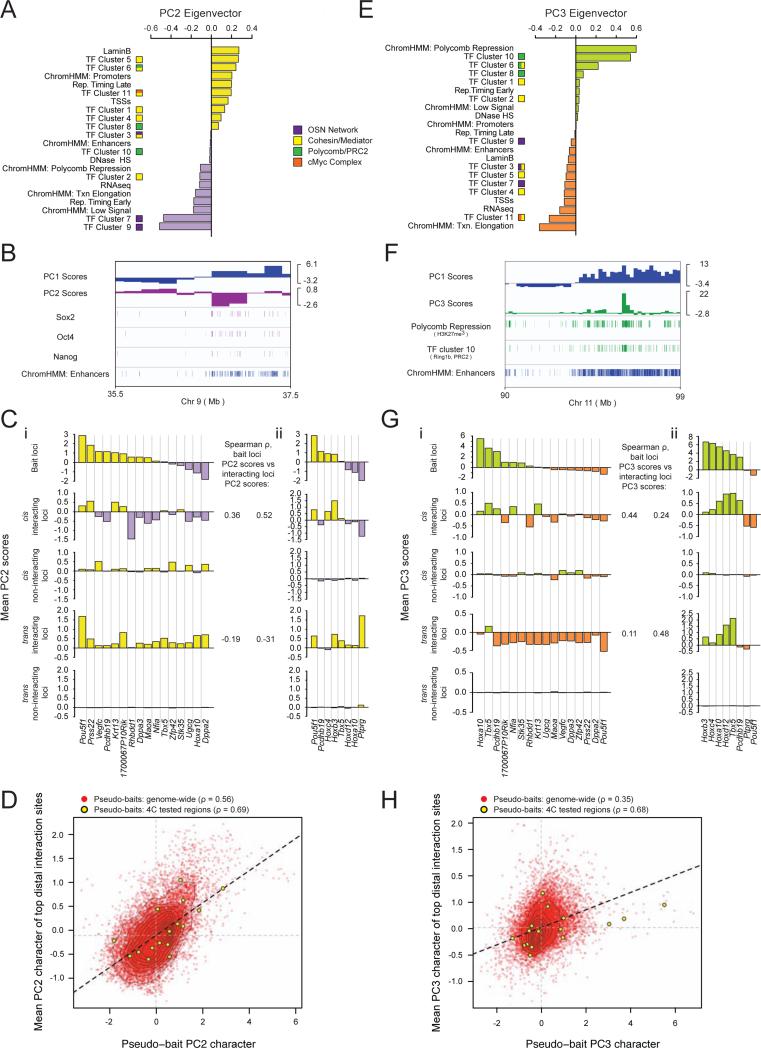
Figure 4. Regions of shared transcriptional network occupancy preferentially interact.
A, PC2 eigenvector with individual feature contributions. TF clusters and chromatin states as in Figure 3.
B, Integrative Genomics Viewer tracks of a representative genomic region with PC1 and PC2 scores; Sox2, Oct4, and Nanog occupancy; and enhancer density.
C, (i) Top to bottom: mean PC2 score within the 1Mb region centered on each bait's locus; interacting regions in cis; non-interacting regions in cis; interacting regions in trans; non-interacting regions in trans. Spearman rho's give the correlation between the baits’ PC2 and the interactomes’ PC2 character across all analyzed baits in cis and trans. (ii) Identical analysis to (i) except for an independently derived ESC line discussed in Figure 7 as Eed+/+ ESCs, with a partially overlapping set of bait loci.
D, Genome-wide pseudo-4C analysis of Hi-C data as described in Figure 3G, except for PC2.
E, PC3 eigenvector with individual feature contributions.
F, Integrative Genomics Viewer tracks showing a representative genomic region with PC1 and PC3 scores; H3K27me3 and TF cluster 10 (Ring1b/PRC2) enrichment, as well as enhancer density.
G, As in (C), except for PC3 scores.
H, As in (D), except for PC3 scores.
See also Figures S3 and S4.

