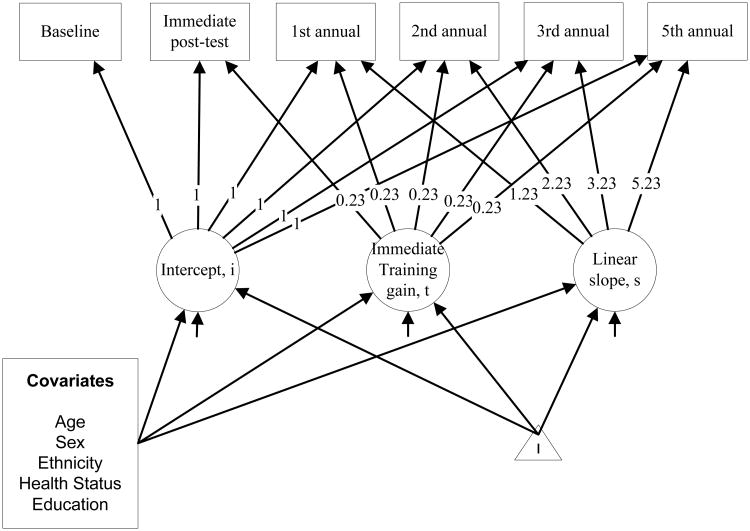
Figure 1. Multiple Group Latent Growth Curve Model of Composite Memory Performance.
Note: This figure represents the parameterization of the latent growth model for Model 1. Observed memory composite scores are displayed in squares. Three latent variables capturing change over time are illustrated: i captures baseline (pre-training) and loads in each study visit with unit weight; t captures the immediate effect of training and practice, loading in study visits with unit weight; and s captures the annual change in composite performance, loading in study visits with fixed time steps reflecting years from baseline. The level (i) and linear slope (s) factors are handled as random effects. The triangle represents a constant effect, illustrating that we are modeling means in i, s, and t. Means (and variances/covariances) are estimated separately for the Non-adherent A, Adherent A, Non-adherent B, and Adherent B groups. In the final model-building step, latent growth factors were regressed on demographic covariates.

