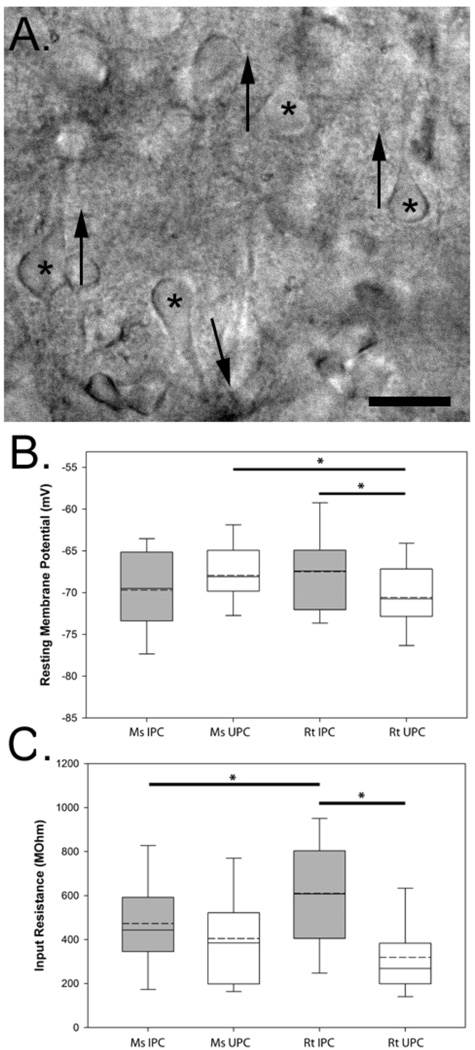
Figure 1.
Visualization and recording of inverted pyramidal neurons. (A) IR-DIC photomicrograph of a mouse slice maintained in vitro where the somata (asterisks) and apical dendrites of numerous UPCs (up arrows) can be seen as well as an IPC (down arrow). Measurements of the resting membrane potential (B) and input resistance (C) of the recorded neurons grouped by species and cell-type. Asterisks denote significant differences between groups (p<0.05). The boundary of the box closest to zero indicates the 25th percentile while the boundary of the box farthest from zero indicates the 75th percentile. Solid lines within the boxes mark the median while dashed lines mark the population mean. Error bars above and below the box indicate the 90th and 10th percentiles. Scale bar in A: 30µm.

