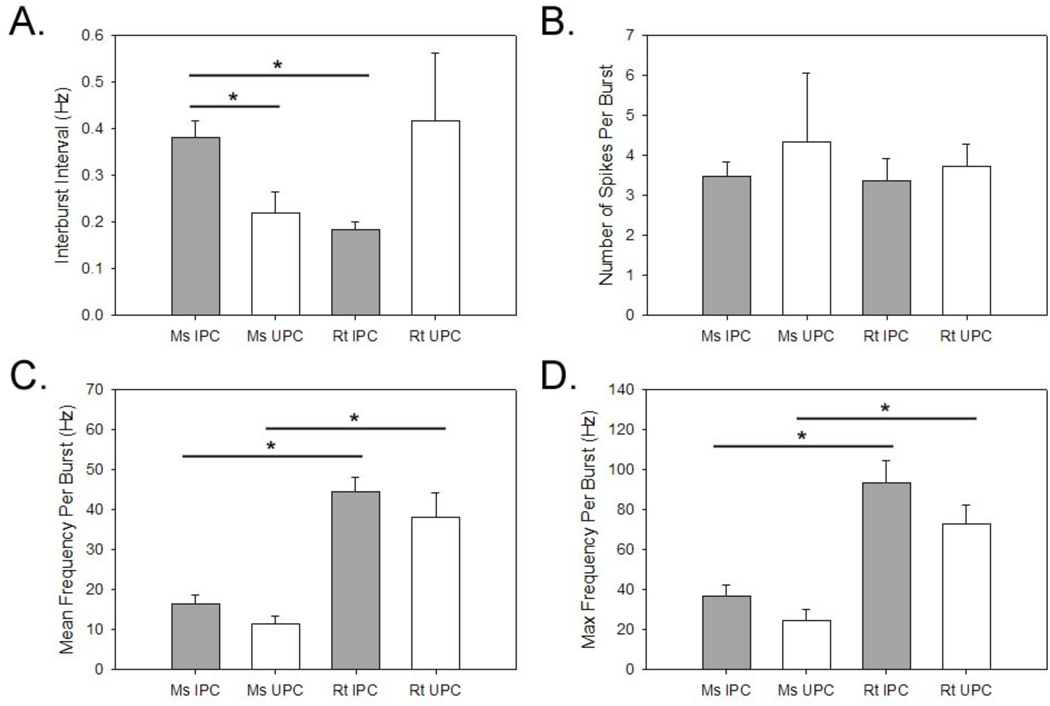
Figure 5.
Properties of burst firing during 0mM Mg2+ ACSF experiments. Average time between bursts (A), average number of action potential during bursts (B), average firing (C), and maximum firing (D) frequency during bursts. Asterisks denote significant differences between groups (p<0.05). Plots represent population means and error bars indicate standard error of the mean.

