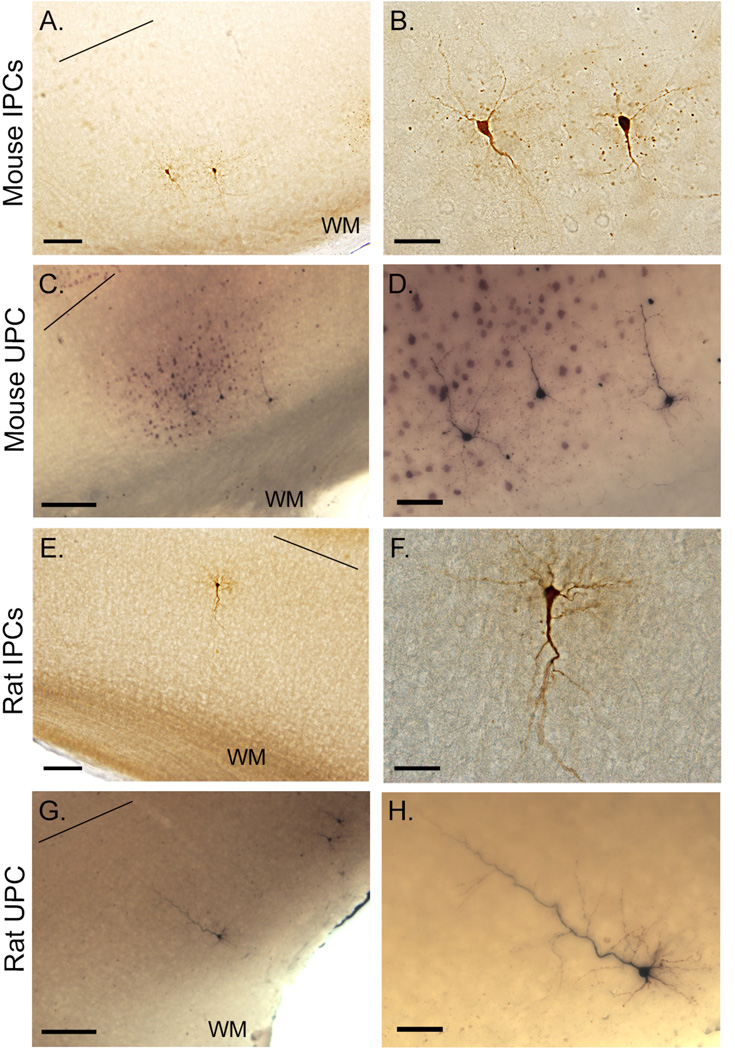
Figure 6.
Representative photomicrographs of biocytin-filled IPCs and UPCs. Flled neurons following physiological experiments in the mouse (IPC: A–B; UPC: C–D) and rat (IPC:E–F; UPC: G–H) cortex. Black line above neurons indicated layer V/VI border. Micrographs are taken at single focal plane. Scale bars in A, C, E, G = 250; B, F = 60; D, H = 30 (all in µm).

