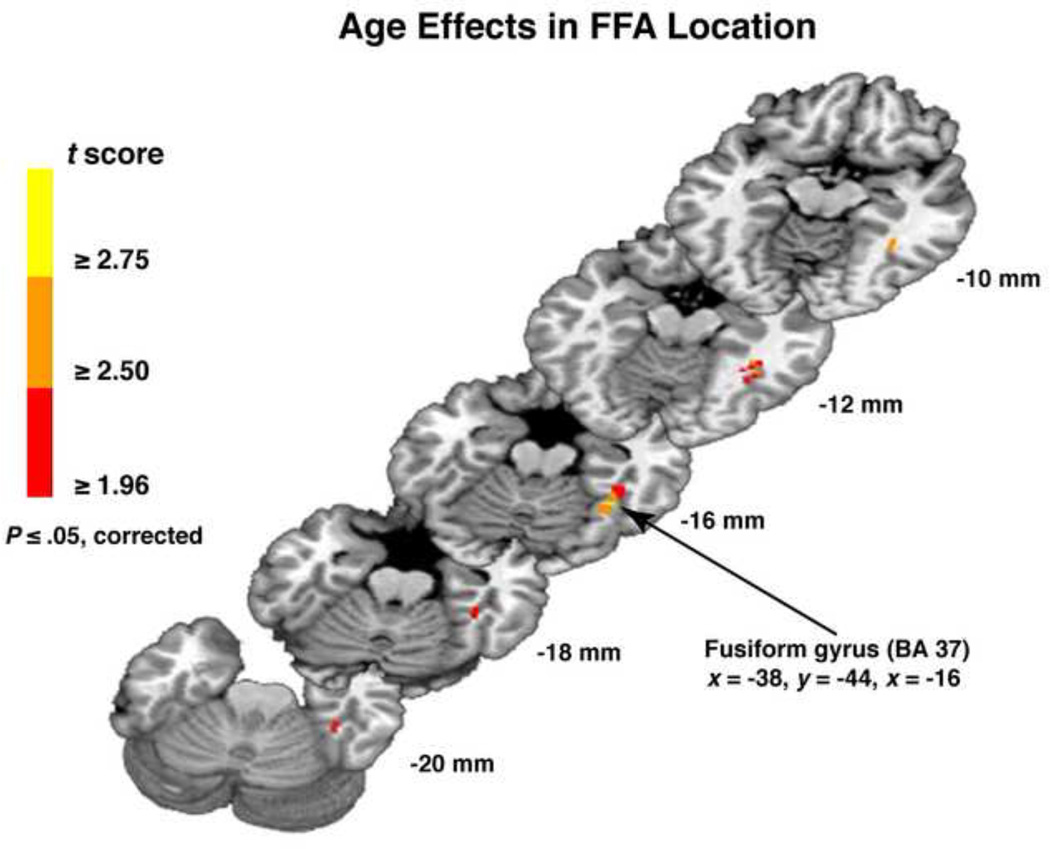
Figure 4.
Findings of FFA spatial differences related to age. The results of the logistic regression analysis that showed the spatial distribution of voxels within the fusiform gyrus (FFA) with a significant association to age. A cluster of voxels in the right fusiform gyrus (BA 37) showed a positive relationship indicating that this region is significantly more likely to be included in the FFA with increasing age of participants. The MNI (SPM) equivalent of the Talairach coordinates shown in the figure are x = −40, y = −47, z = −17. Color bar indicates the t score of the voxel in the logistic regression analysis.

